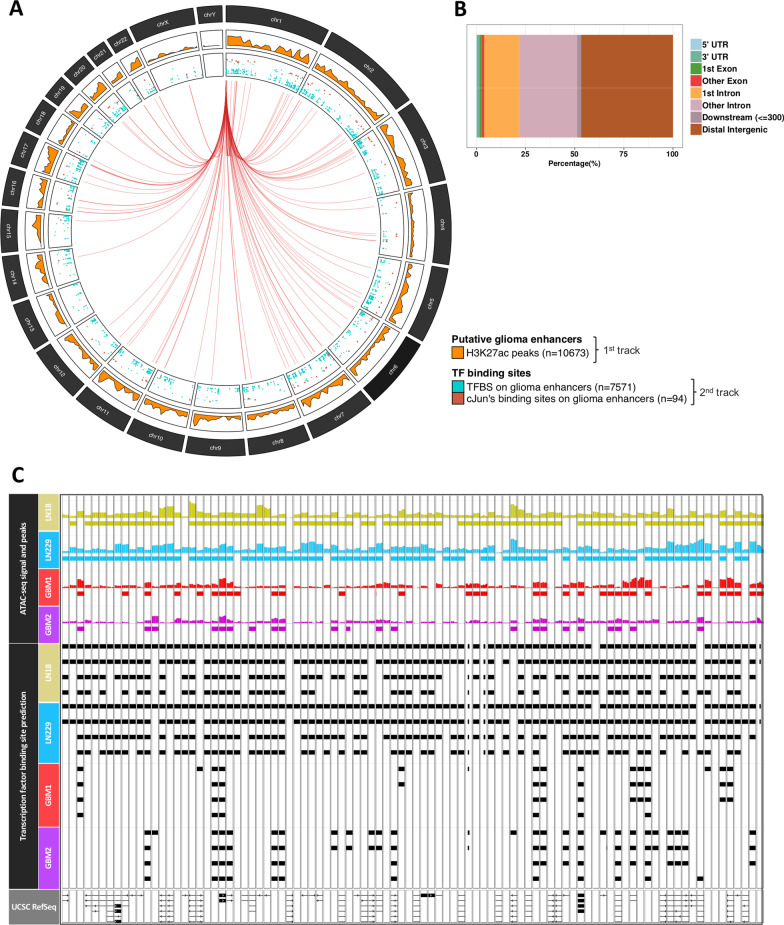
Fig. 4.
The integration of the glioma enhancer atlas in the context of c-Jun and related factors. A The density of the ChIPseq H3K27ac peak from the predicted glioma enhancer atlas (1st track) identified by Stepniak et al. TFBS motif predictions in LN18 and LN229 glioma cell lines inside enhancers and c-Jun binding sites are displayed separately (2nd track). Each putative JUN motif found in glioma enhancers is linked to JUN gene position (chr1:58,776,845–58,784,048). B Feature distribution of glioma enhancer (H3K27ac peaks). C Integration of glioma enhancers and chromatin openness in glioma cell lines and GBM specimens with TFBS for c-Jun and other bZIP proteins. Exons (rectangles) and introns (lines) are depicted as well as the gene orientation (arrows) in the UCSC gene composite track

