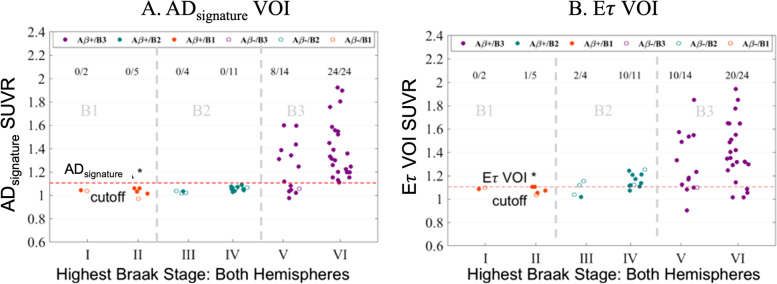
Fig. 4.
A Scatter plot of Braak stage vs ADsignature VOI SUVR. The red dotted line represents the ADsignature positivity cutoff of 1.1059. The numbers at the top represent the number of subjects for each Braak stage. For example, for Braak VI, 24/24 indicates that of the 24 Braak VI subjects in this analysis, 24 had elevated ADsignature signals. B Scatter plot of Braak stage vs Eτ VOI SUVR. The red dotted line represents the Eτ VOI SUVR positivity cutoff of 1.1052. Amyloid positivity is defined by a CERAD score of moderate to frequent at autopsy

