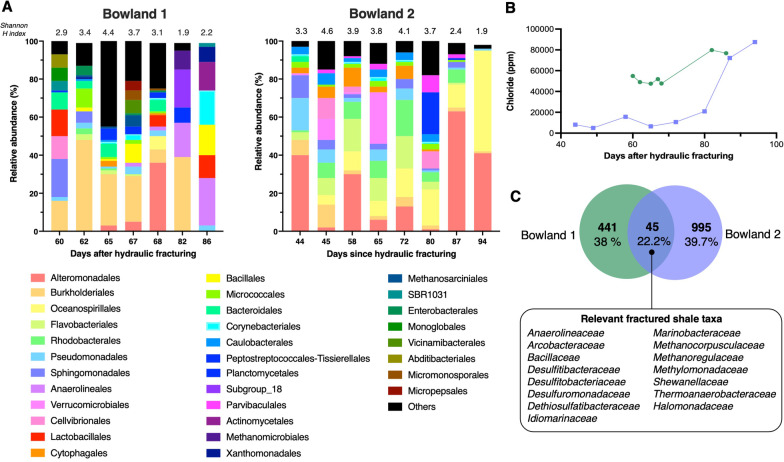
Fig. 1.
Microbial community composition of flowback fluids derived from the Bowland shale exploration wells. A Relative abundance of microbial classes in flowback fluids from the Bowland shale. All classes that represent ≥ 5% of sequences from any sample are listed on the bar plot, the rest are grouped as “Other”. B Temporal changes in chloride (ppm) concentration in the Bowland-1 (green) and Bowland-2 (purple) flowback fluids. C Venn diagram depicting the number of shared and unique ASVs (percentage of the total number of sequences) in each well. Relevant shared taxa at family level, i.e., organisms associated with shale systems and hydrocarbon reservoirs reported in previous studies, are indicated in the box

