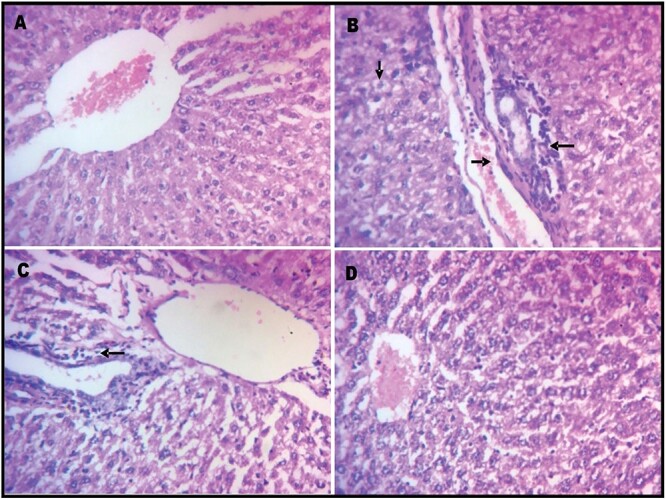
Fig. 4.

Liver photomicrographs of H&E sections of Wistar rats treated with mancozeb (30 mg/kg, ip) with or without curcumin (100 mg/kg, po) for 10 days, magnification: 400×. A) control group, B) group treated with mancozeb, C) mancozeb co-treated with curcumin group, and D) group treated with curcumin alone. Tissues stained with hematoxylin and eosin. Arrows indicate pathomorphological changes: vascular congestion (left arrow), pyknotic nuclei (down arrow), and periportal inflammation (right arrow).
