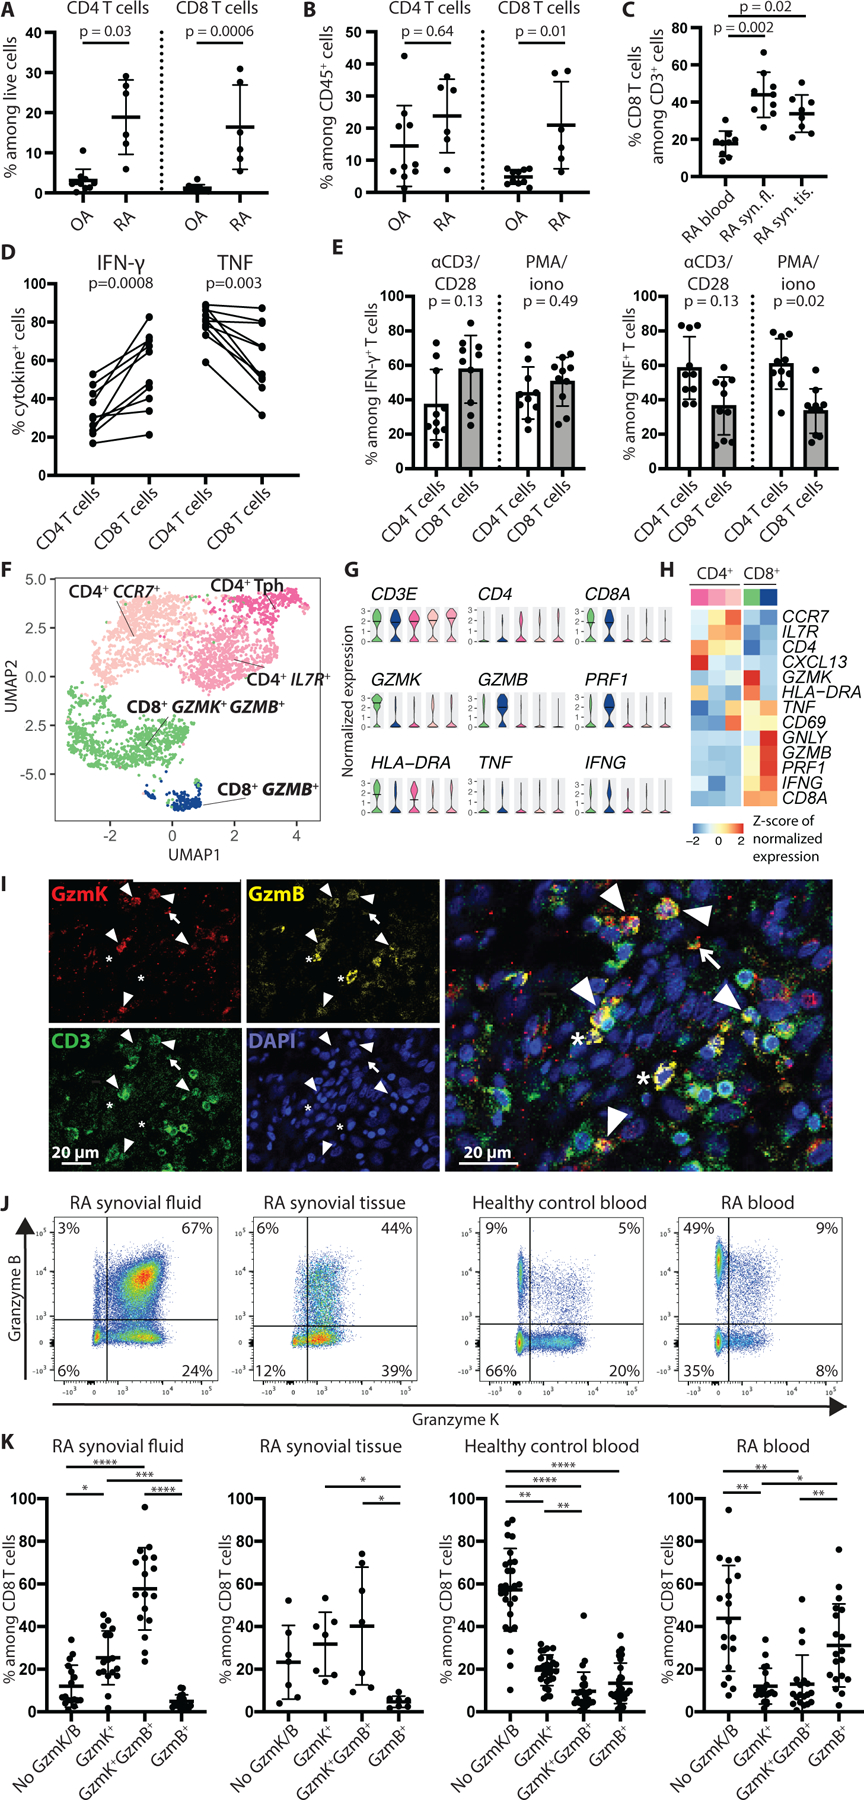
Fig. 1. CD8 T cells in RA synovial tissue and fluid make TNF and IFN-γ and predominantly express GzmK, whereas only a small portion express GzmB alone.

(A and B) Frequency of CD8 T cells among total live cells (A) and CD45+ cells (B) is shown in synovial tissue from patients with active RA (n=6) compared to OA (n=10) in a published synovial tissue mass cytometry dataset (10). (C) Frequency of CD8 T cells among total T cells in blood (n=9), synovial fluid (syn. fl., n=9), and synovial tissue (syn. tis., n=8) of RA patients is shown. (D) The frequency of CD4 and CD8 T cells producing IFN-γ and TNF is shown for seropositive RA synovial fluid (n=10) after stimulation with PMA and ionomycin (PMA/iono) for three hours. Paired CD4 and CD8 T cell data from the same patient are connected by a line. (E) The percentage contribution to total IFN-γ- or TNF-producing T cell pool by CD4 versus CD8 T cells from seropositive RA synovial fluid (n=10) is shown after stimulation with anti-CD3/CD28 antibody-coated beads or PMA and ionomycin for three hours. (F) A UMAP plot of Louvain clustering of 4,111 single-cell RNA-seq profiles synovial tissue T cells is shown. (G) Violin plots are shown illustrating expression of selected genes by cells in each cluster from the UMAP plot in (F). (H) A pseudobulk heatmap shows expression of selected genes by the CD4 and CD8 T cell clusters shown in (F). (I) Immunofluorescent staining of RA synovial tissue is shown. White arrowheads indicate GzmK+ GzmB+ T cells. The arrow points to a GzmK+ T cell, and the asterisks indicate GzmB+ cells, which do not stain for CD3. (J and K) Representative flow cytometry plots (J) and cumulative data (K) show GzmK and GzmB expression among CD8 T cells from synovial fluid (n=17), synovial tissue (n=7), and blood (n=21) from patients with RA and blood from healthy controls (n=27). Bars in (A to C, E, and K) represent mean ± SD. Statistics by Mann-Whitney U-test (A and B), Kruskal-Wallis test (C), two-tailed ratio paired t-test (D and E) and Friedman test with Dunn’s multiple comparisons test (K) are shown. *p<0.05, **p<0.01, ***p<0.001, ****p<0.0001.
