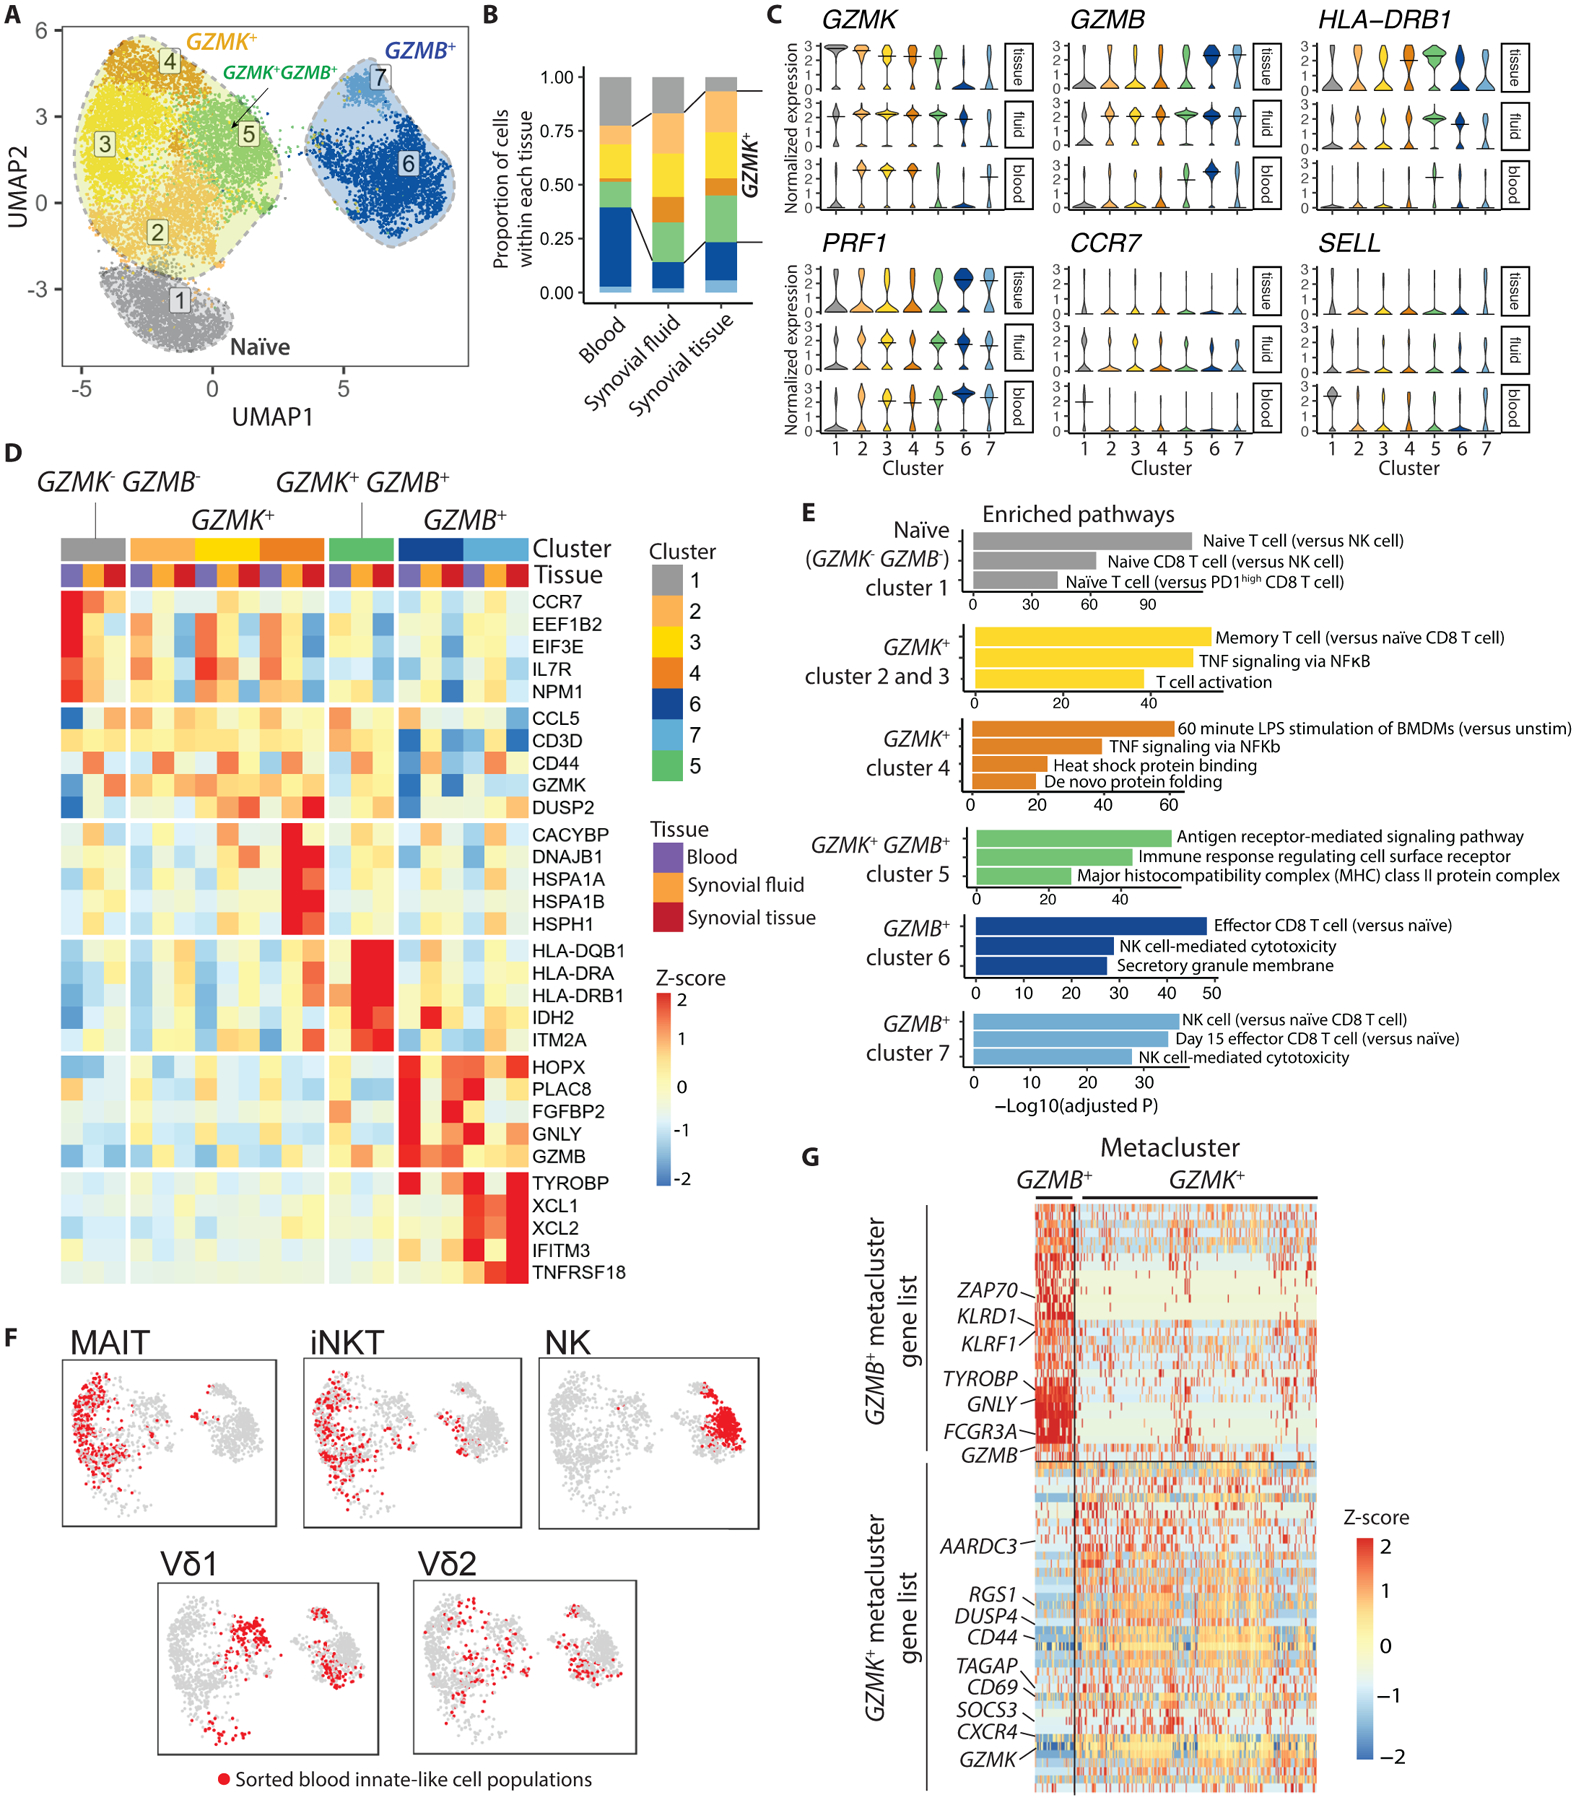
Fig. 2. CD8 T cells and other granzyme-expressing lymphocytes in RA synovial tissue, fluid, and blood segregate into transcriptional clusters characterized by GzmK and GzmB expression.

(A) Clustering of 11,602 single-cell profiles from RA synovial tissue and fluid as well as healthy control blood reveals 7 distinct clusters. Clusters of cells are projected into UMAP space. (B) Proportion of cells of each cluster is shown by tissue source. (C) Violin plots are shown depicting expression of cluster marker genes among cells from synovial tissue, synovial fluid, and blood. (D) Heatmaps show Z-scores of the average expression of selected genes, separated by tissue source. Most significantly enriched pathways per cluster are shown next to the heatmaps. (E) Most significantly enriched pathways per cluster are shown. (F) Projections of sorted innate-like T cell and NK cell populations are shown in UMAP space. (G) A heat map displaying differentially expressed genes between the GzmK and GzmB metaclusters, which make up the GzmK and GzmB gene signatures, is shown.
