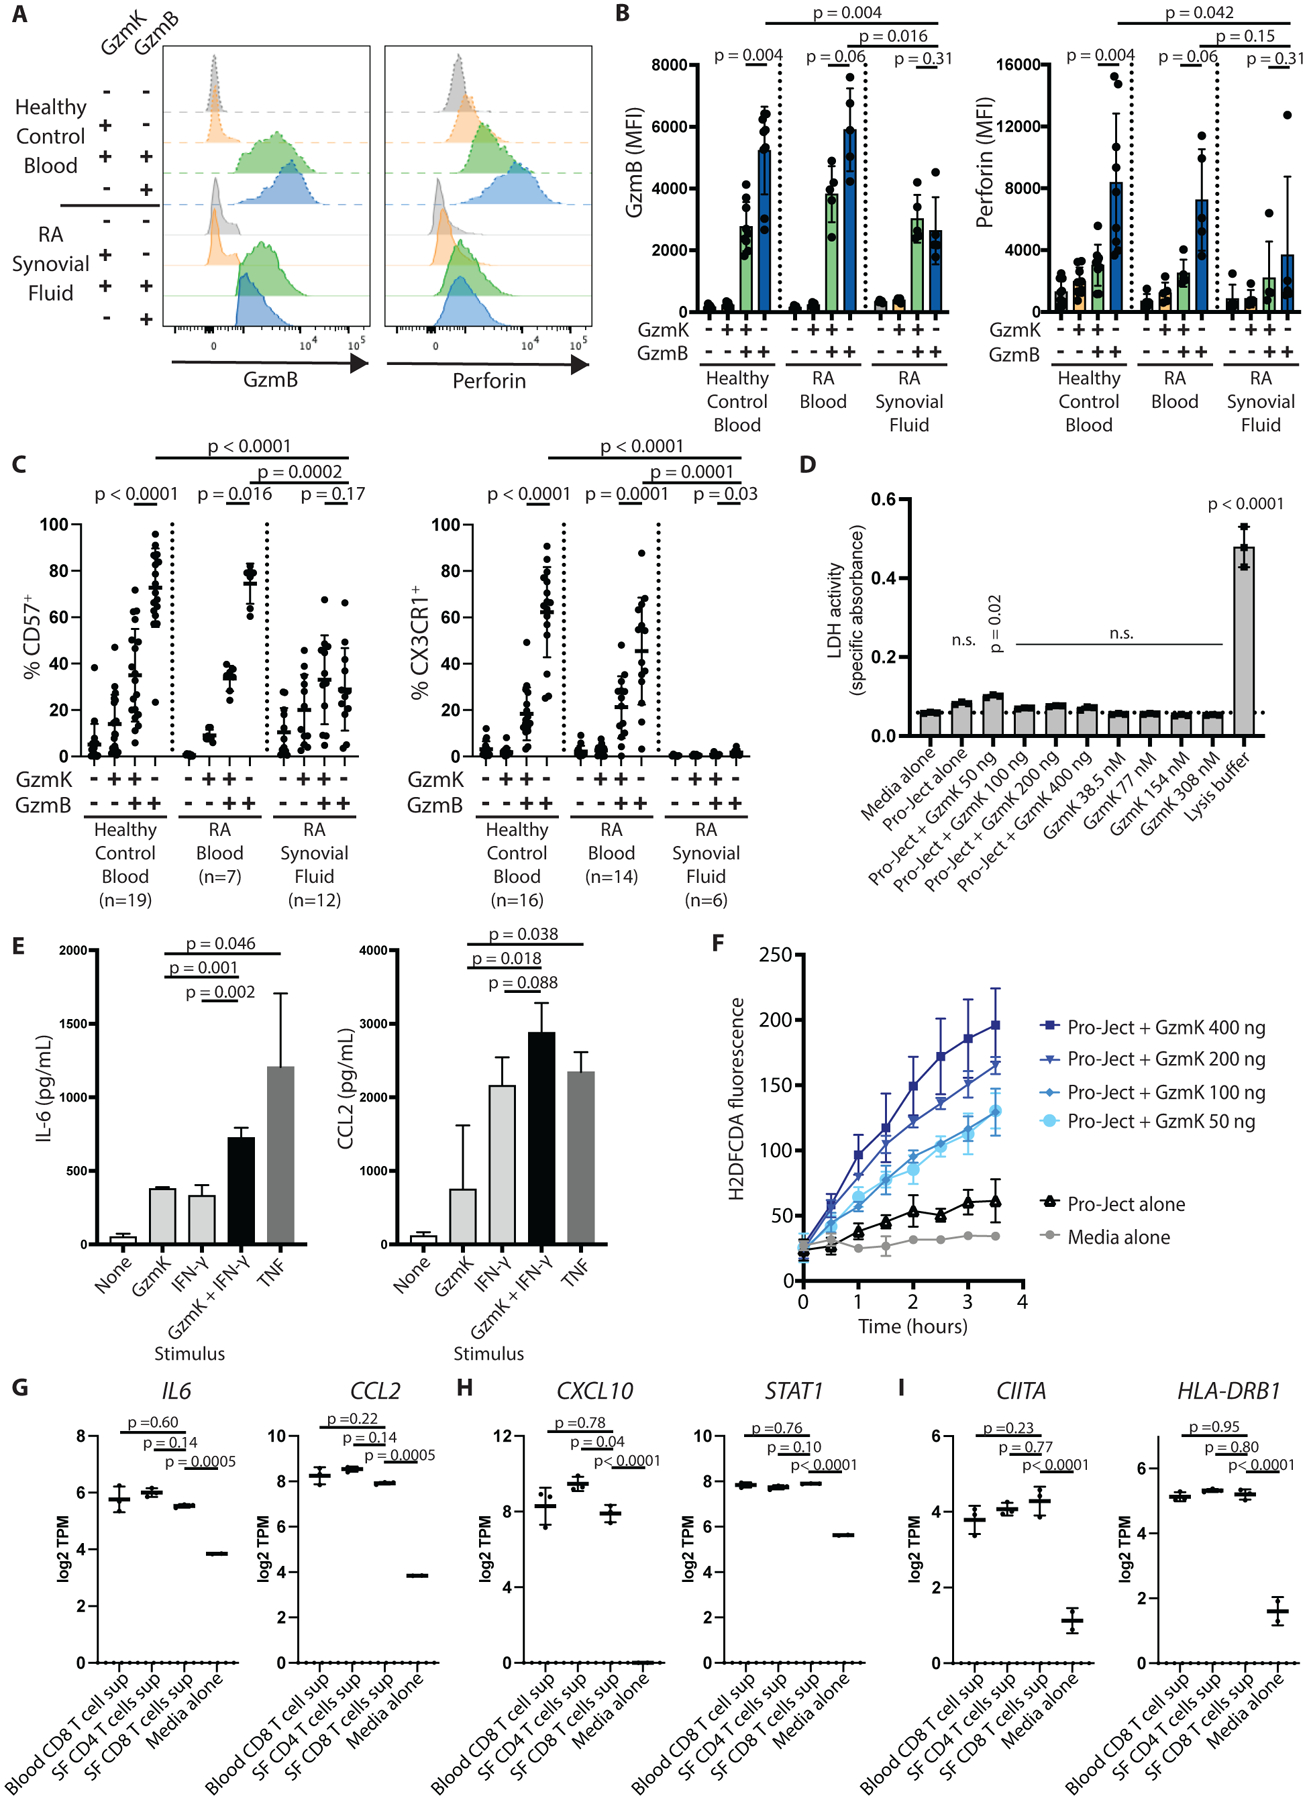
Fig. 3. GzmK+ GzmB+ CD8 T cells have reduced cytotoxic potential in both healthy control blood and synovial fluid.

(A) Histograms show GzmB and perforin expression by the indicated CD8 T cell subset from healthy control blood (dashed lines) or RA synovial fluid (solid lines). (B) Cumulative mean fluorescence intensities (MFI) for GzmB and perforin staining by the indicated CD8 T cell subset are shown for healthy control blood (n=9), RA blood (n=5), and RA synovial fluid (n=5). Bars represent SD. (C) Expression of cytotoxic markers CD57 and CX3CR1 by the indicated CD8 T cell population are shown for healthy control blood, RA blood, or RA synovial fluid, as measured by flow cytometry. Bars represent SD. (D) RA synovial fibroblasts were incubated for 24 hours with recombinant enzymatically active GzmK in the culture supernatant or packaged into a protein transfection reagent (Pro-Ject). Cell death was measured by LDH release assay. Bars show SD of technical replicates. Representative of two independent assays. (E) RA synovial fibroblasts were incubated with recombinant GzmK, IFN-γ, or TNF for 24 hours, and IL-6 and CCL2 production was measured by enzyme-linked immunosorbent assay (ELISA). Bars show mean ± SD of three technical replicates; representative of four independent assays. (F) Recombinant GzmK was packaged into a protein transfection reagent and applied to RA synovial fibroblasts. ROS production was measured by 2’,7’-dichlorodihydrofluorescein diacetate (H2DFCDA) fluorescence over time. (G to I) Expression of selected genes involved in (G) pro-inflammatory signaling, (H) IFN-γ signatures, and (I) antigen processing and presentation are shown for low-input RNA-seq data of RA synovial fibroblasts stimulated with supernatants from the indicated T cell subset. SF, synovial fluid; TPM, transcripts per million. Bars show mean ± SD of three biological replicates. Statistical testing was done by (B and C) Wilcoxon matched-pairs signed rank test (within tissues) and Mann-Whitney test (across tissues); (D, G to I) one-way ANOVA with Dunnett’s multiple comparisons test, comparing all groups to (D) media alone or (G to I) synovial fluid CD8 T cell supernatant-stimulated cells, and (E) unpaired t-test. n.s., not significant.
