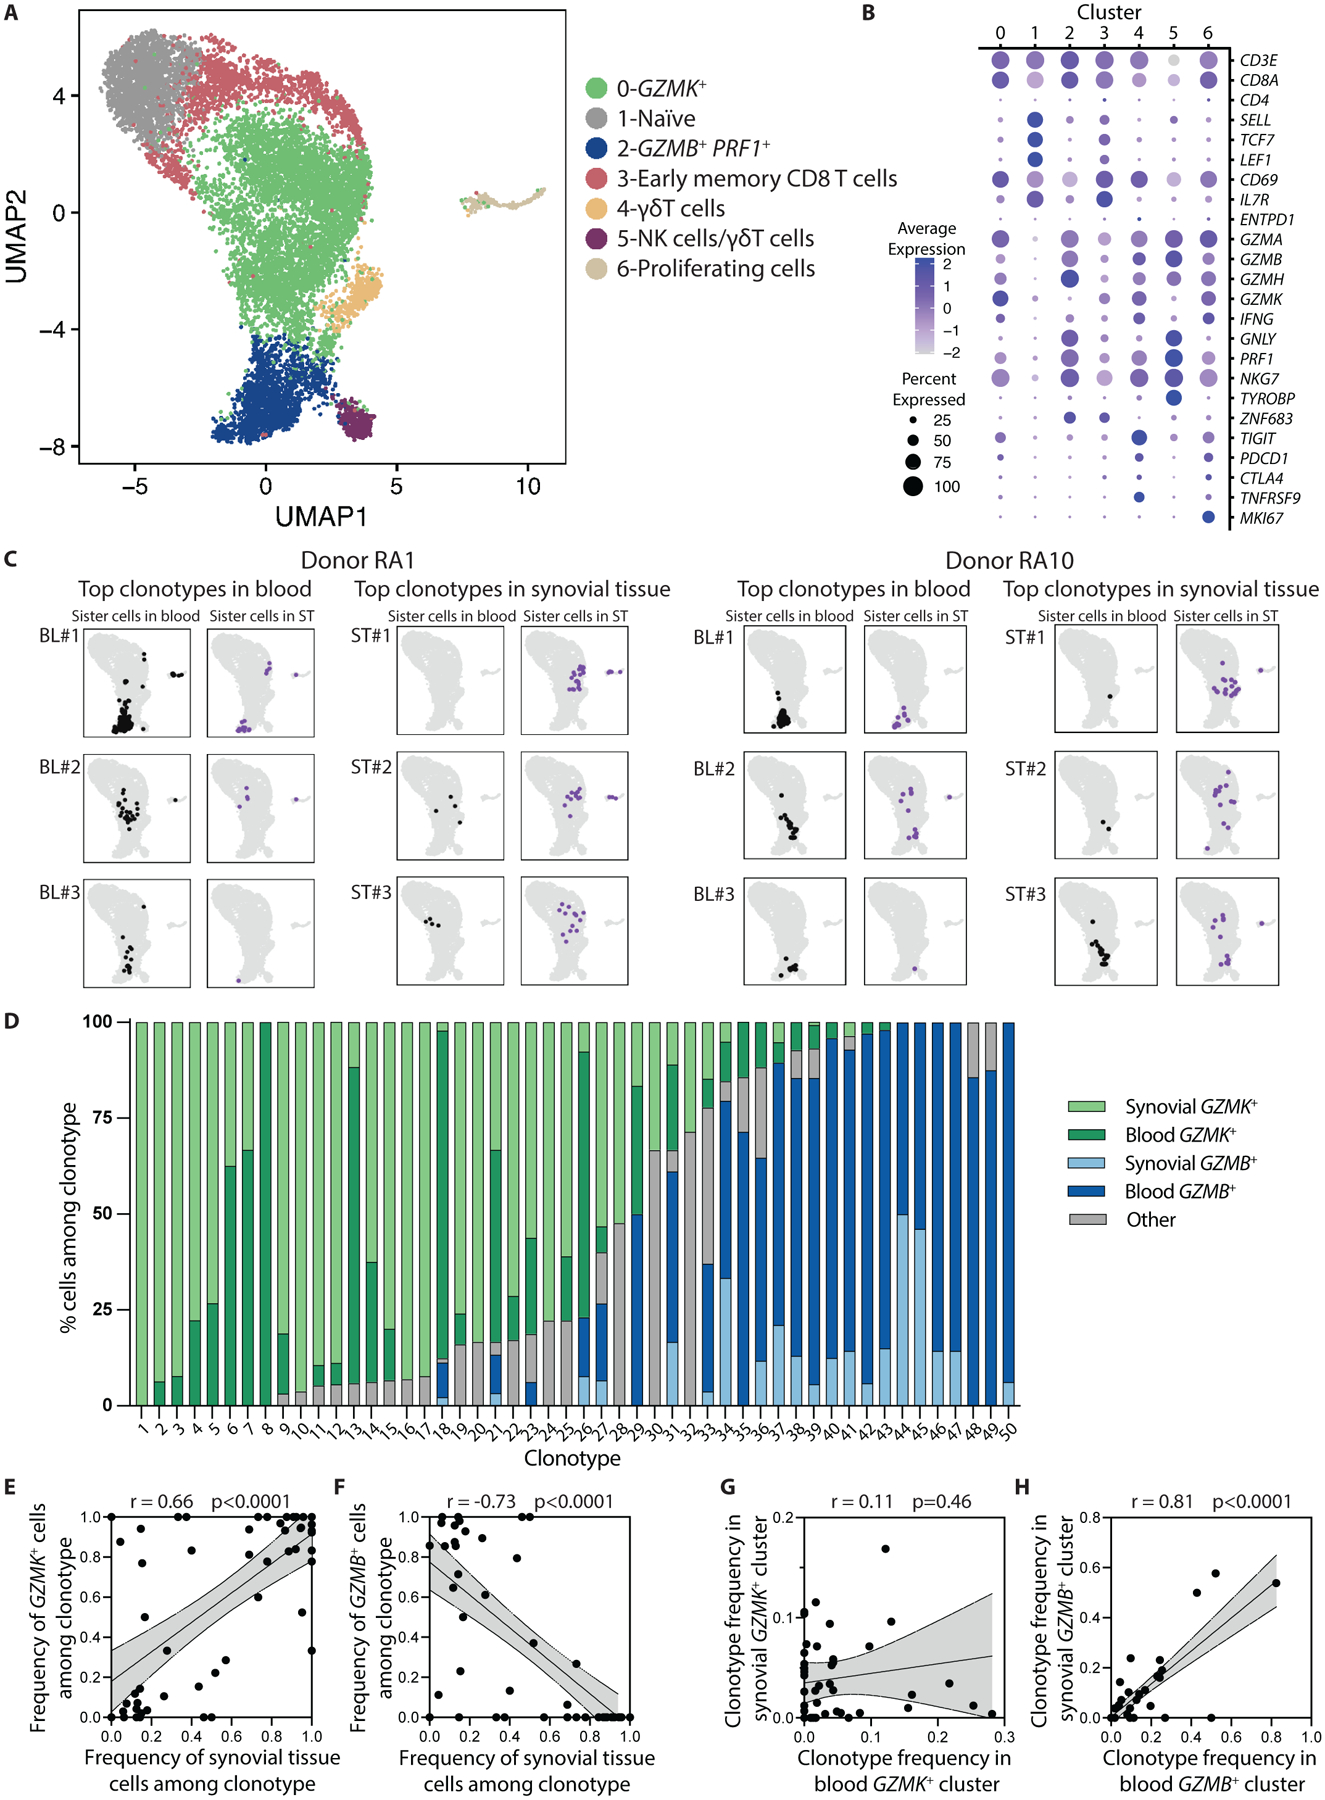
Fig. 5. TCR repertoire data connects synovial GZMK+ CD8 T cells with GZMK+ CD8 T cells in blood.

(A) A UMAP plot of Louvain clustering of 11,030 single-cell profiles from RA synovial tissue (6,555 cells) and matched blood (4,475 cells) reveals 7 distinct clusters. (B) Expression of selected markers is shown for the individual clusters shown in (A). (C) Mapping of sister cells belonging to the top 3 most frequent clonotypes in blood and synovial fluid from two representative patients shows that cells within a clonotype tend to map to the same location within the UMAP, whether they are in blood or synovial tissue (ST). (D) Transcriptional cluster and tissue origin is shown for clonal cells in the 50 analyzed clonotypes. Cells mapping to any of the five clusters other than GZMK+ or GZMB+ were categorized as “other.” (E and F) Correlations are shown for the frequency of synovial tissue cells among each of the 50 analyzed clonotypes and the frequency of clones in the GZMK+ (E) or GZMB+ (F) cluster in that clonotype. (G and H) Correlations are shown for the frequency of each of the 50 analyzed clonotypes among blood and synovial tissue CD8 T cells in the GZMK+ (G) or GZMB+ (H) cluster in that individual. Statistical testing was done by Pearson correlation.
