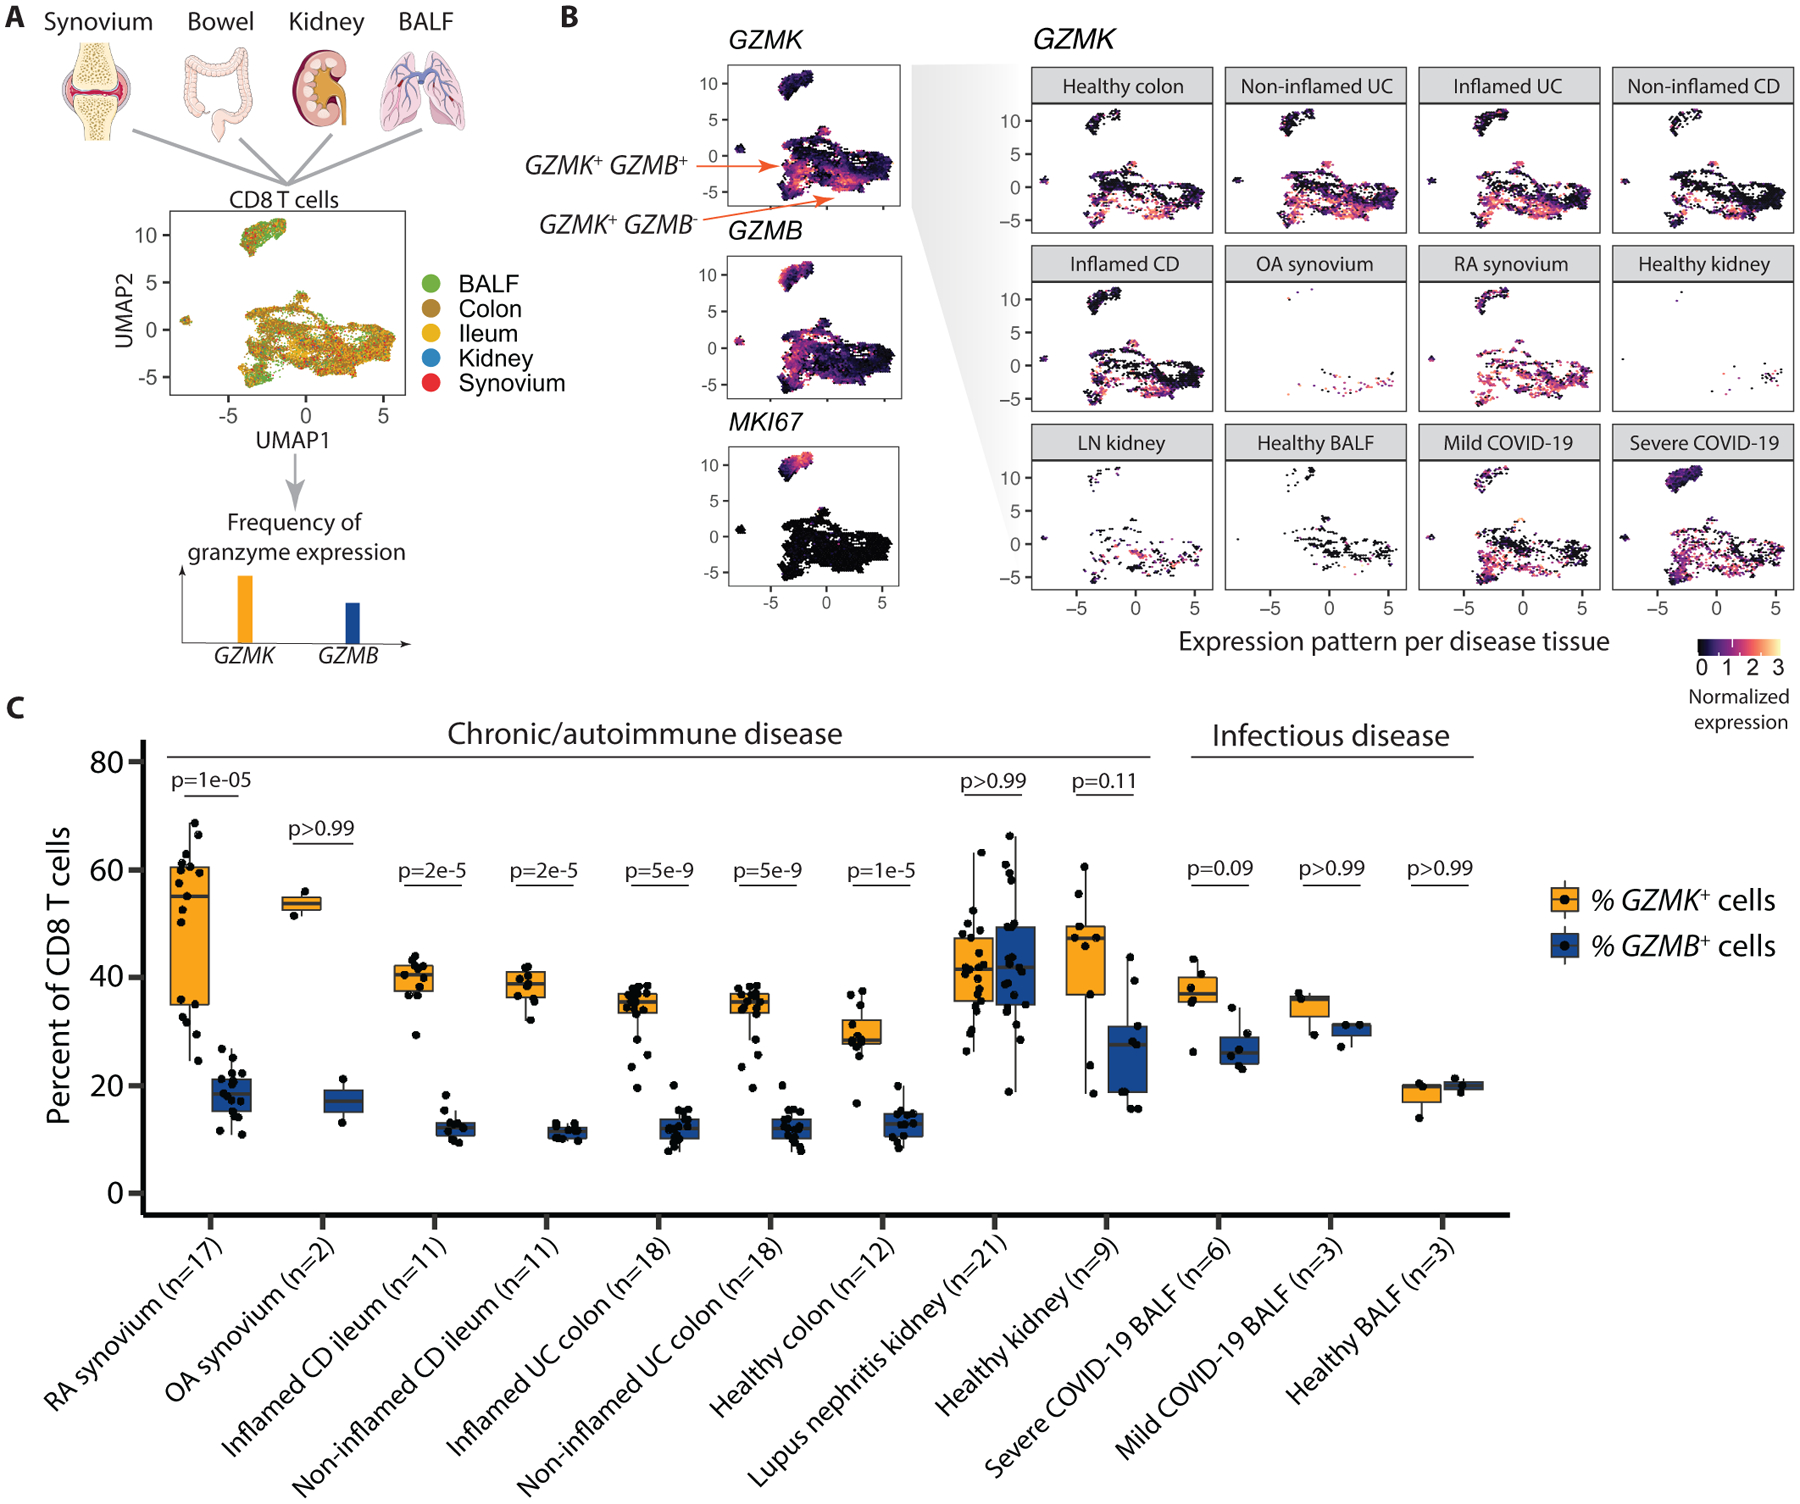
Fig. 6. GZMK is prominently expressed by CD8 T cells isolated from multiple healthy and diseased tissues.

(A) The diagram illustrates the unbiased integration of 26,625 single-cell profiles from CD8 T cells in RNA-seq datasets from healthy or diseased tissues from RA synovium, Crohn’s disease (CD) ileum, ulcerative colitis colon, lupus nephritis (LN) kidney, and COVID-19 bronchoalveolar lavage fluid, where colors represent different tissue sources. The frequency of GZMK and GZMB gene expression was then assessed. (B) Expression pattern of GZMK, GZMB, and MKI67 (Ki67) is shown for the integrative dataset in UMAP space. The UMAP depicts expression of GZMK by cells from each individual tissue and disease state. (C) The percent of CD8 T cells from the indicated samples expressing GZMK or GZMB mRNA is shown. Data were analyzed by a two-tailed Wilcoxon rank-sum test. Boxplots summarize the median, interquartile range and 95% quantile range.
