Fig. 1.
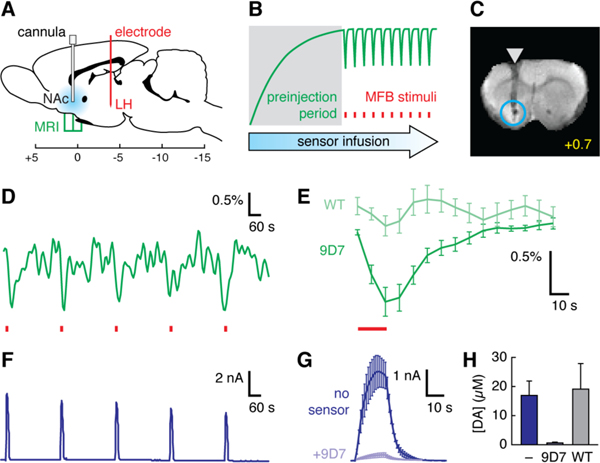
Molecular fMRI detects dopamine signaling in ventral striatum. (A) Stimulation electrodes (red) were implanted in LH. Cannulae in NAc allowed dopamine sensor infusion (blue), and MRI data were acquired from surrounding slices. Scale shows coordinates relative to bregma. (B) Experimental design: sensor preinjection (gray shading) is followed by functional imaging with MFB stimulation (red tics). Green line represents expected MRI signal changes due to injection and stimulus-induced dopamine release. (C) Coronal slice (bregma + 0.7 mm) from a single rat brain following preinjection with BM3h-9D7. Arrowhead denotes cannula and circle defines an ROI. (D) ROI-averaged MRI signal over five stimuli (red tics) in one animal, following preinjection of BM3h-9D7. (E) Average peristimulus IRF calculated within the ROI from animals injected with BM3h-9D7 (dark green, n = 7) or control BM3h-WT (light green, n = 7). Stimulation period indicated by red line. (F) Amperometric measurement of NAc dopamine release evoked by MFB stimuli (red tics). (G) Average (n = 4) amperometry transients before (dark blue) or after (light blue) infusion of BM3h-9D7 (red line = stimulus). (H) Calibrated dopamine amplitudes measured without sensor infusion (dark blue, n = 7), after infusion of BM3h-9D7 (light blue, n = 4), or after infusion of BM3h-WT (gray, n = 3). Error bars denote SEMs.

