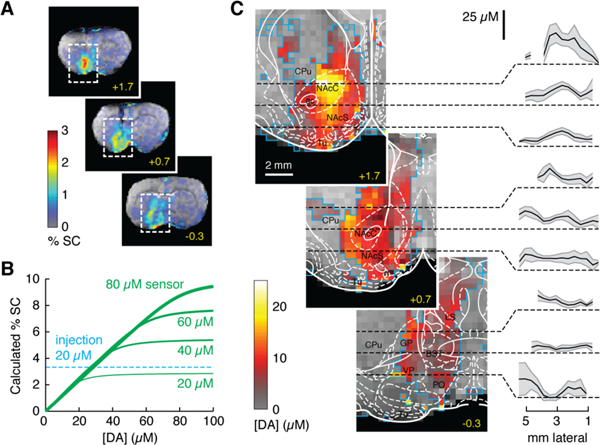
Fig. 2.
Quantitative functional imaging of dopamine concentrations. (A) Raw maps of signal change averaged over seven animals injected with BM3h-9D7. Distribution of percent signal change (%SC) over three coronal sections; rostrocaudal coordinates in yellow. (B) Calculated %SC as a function of released dopamine concentration ([DA]) for four sensor concentrations, showing linearity of %SC vs. [DA], except for saturation effects. In areas that received substantial contrast agent infusion, a ratio of 8 μM dopamine per %SC can be used to estimate dopamine concentrations. (C) Quantitative mapping of average peak dopamine concentrations over regions outlined in panel A. Blue outlines indicate voxels included in the analysis, each incorporating data from 2–7 animals (cf. Fig. S3). Rat brain atlas (20) is overlaid with labels in black; regions defined in text, plus anterior commissure (ac), bed nucleus of the stria terminalis (BST), globus pallidus (GP), lateral septum (LS), olfactory tubercle (Tu), and ventral pallidum (VP). Plots show means (black lines) and SEMs (shading) of dopamine concentrations along dashed lines in respective images.

