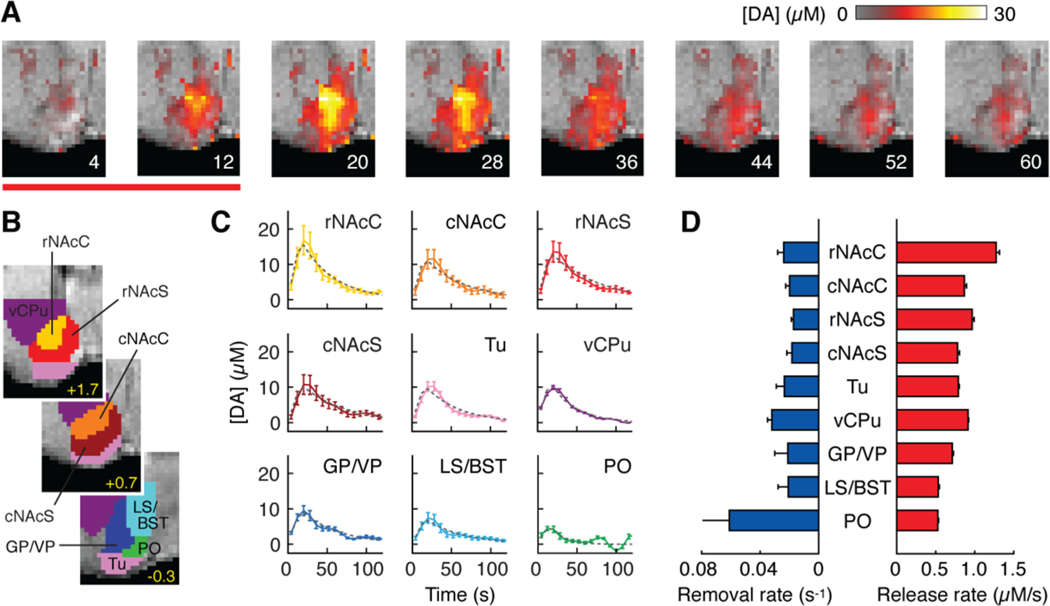
Fig. 3.
Dynamics of dopamine-dependent MRI responses to MFB stimulation. (A) Image frames from the first eight time points of the IRF. Color bar indicates dopamine concentrations during and after an MFB stimulus (red line). (B) ROIs defined by brain atlas alignment to MRI data. (C) IRFs calculated for each ROI. Data points indicate mean [DA] at each time. Gray dashed lines show best-fit simulated time courses using a single compartment model. (D) Dopamine release (red) and removal (blue) rates estimated from model fitting. SEMs computed by jack-knife resampling over seven animals.

