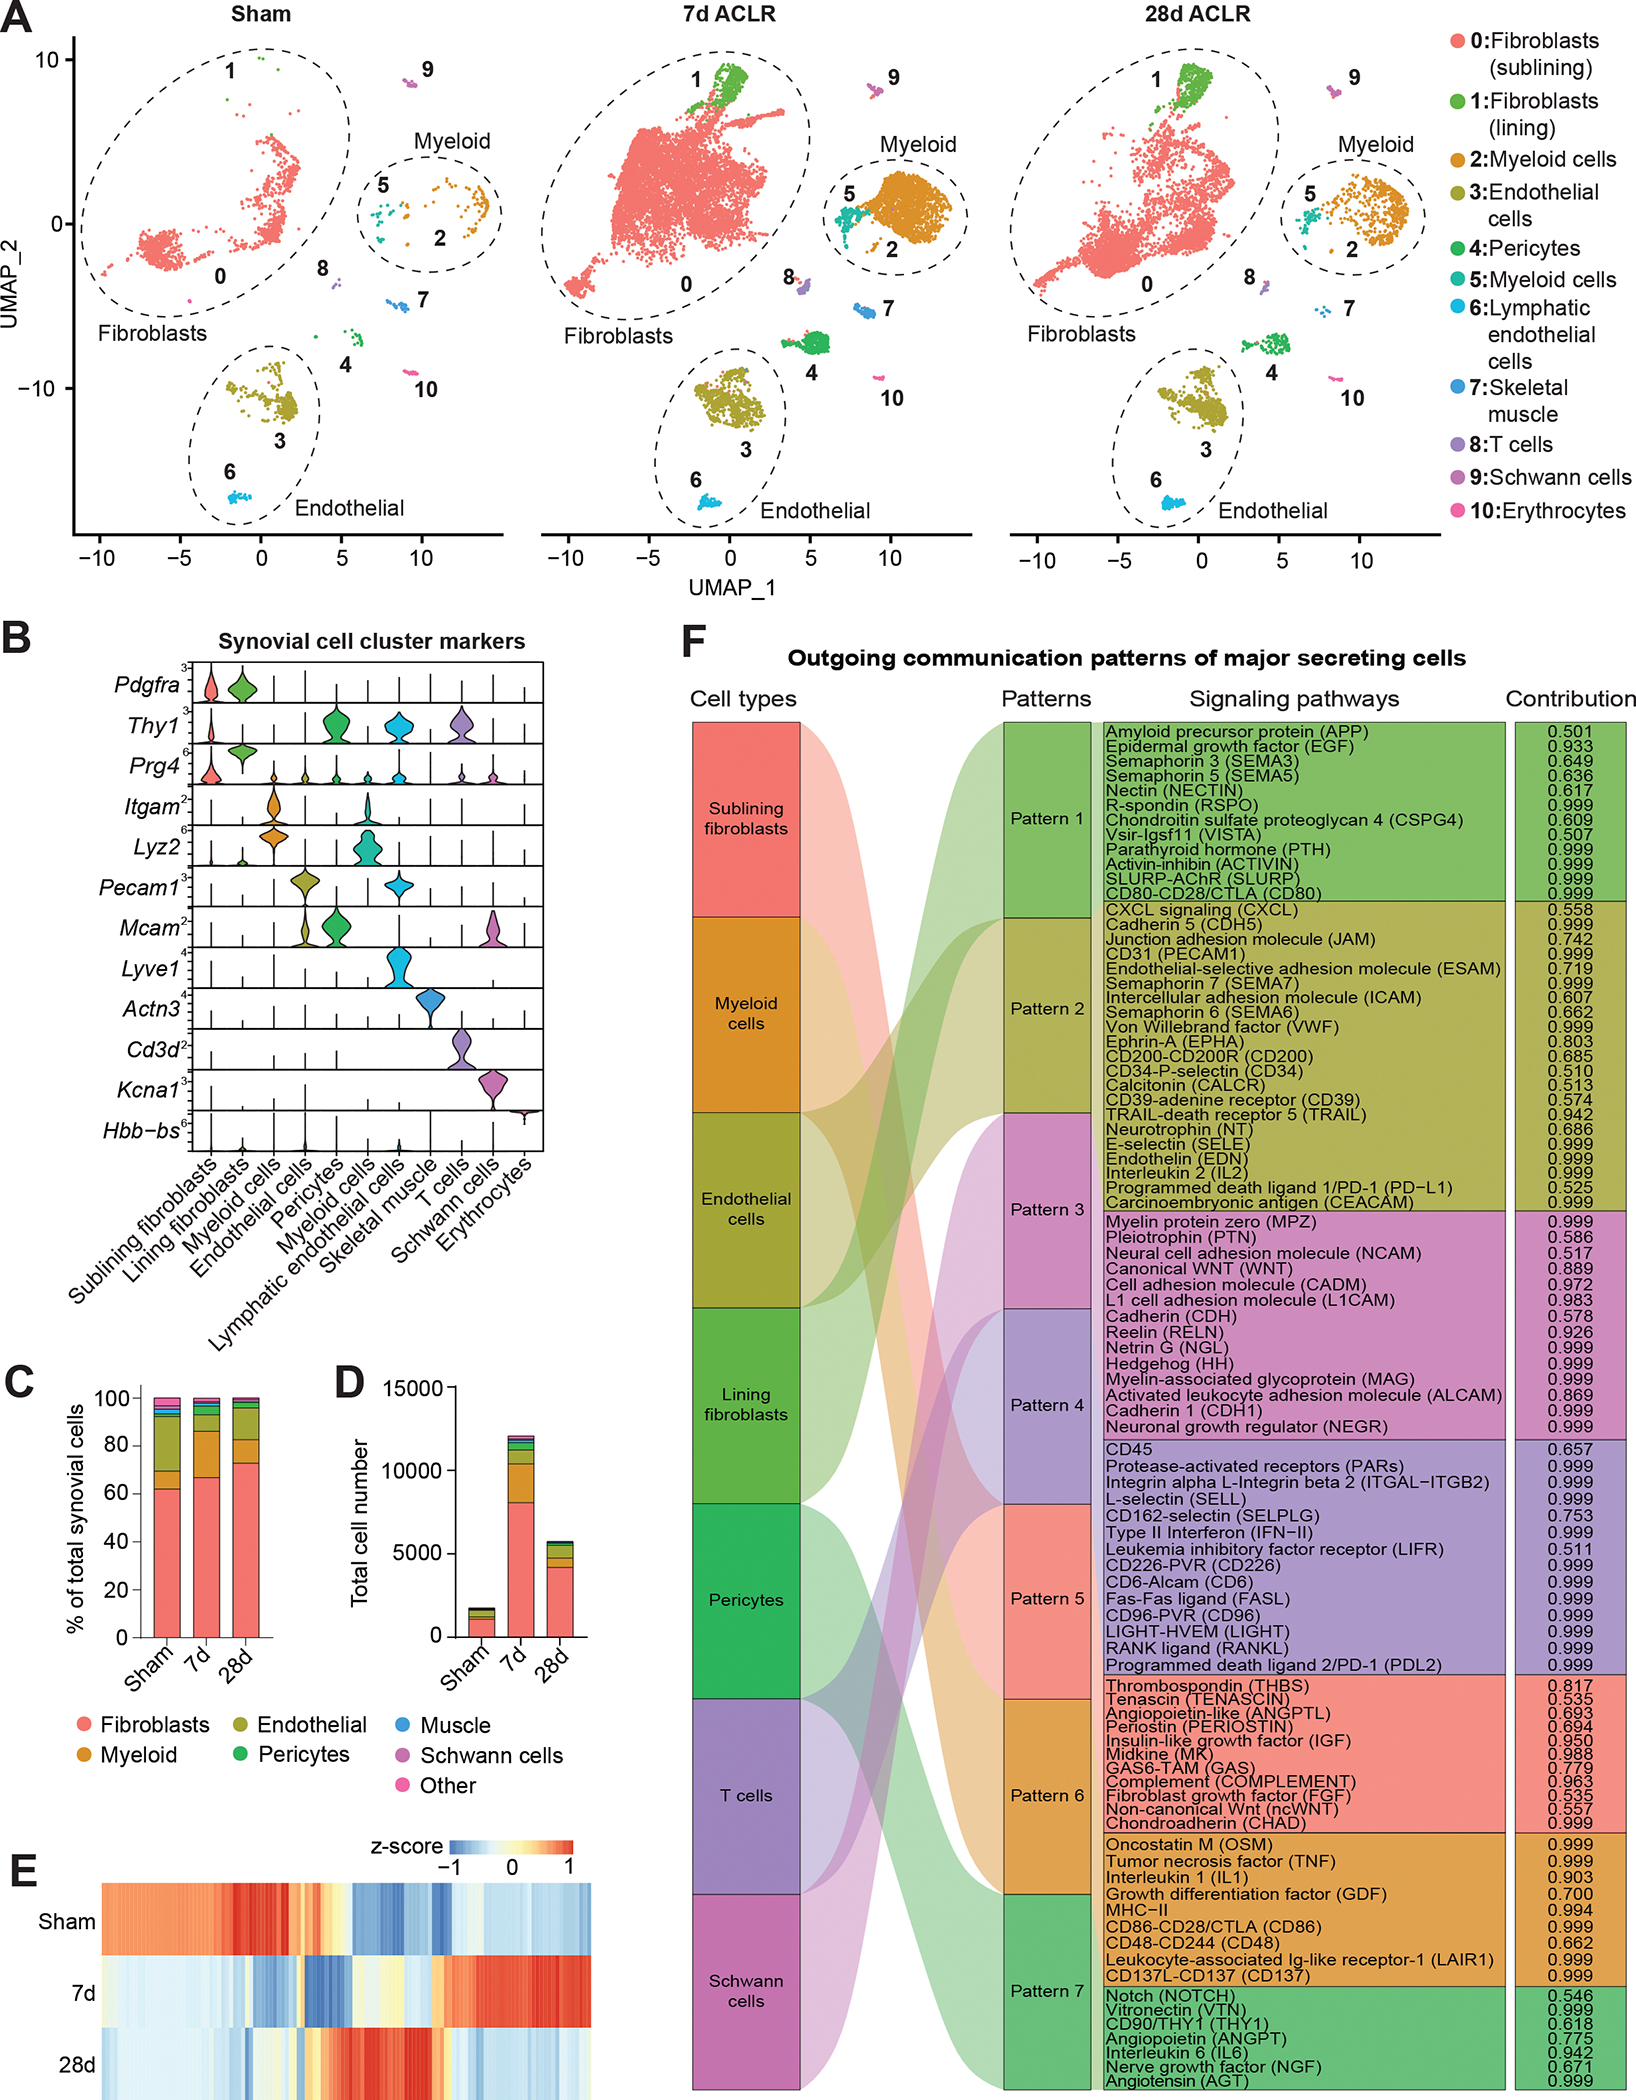
Figure 1. Single-cell transcriptomic profiling of synovium reveals cellular heterogeneity in PTOA.

(A) UMAP plots showing reduced dimensionality projections of all synovial cells from Sham, 7d ACLR or 28d ACLR mice (20,422 cells, n=2 biological replicates per condition, each composed of one male and one female). Cell types are grouped by color and designated numbers, with annotations on the right. Major cell groups have dashed outlines. (B) Violin plots of synovial cell type marker genes. (C) Proportional breakdown of major synovial cell types in each condition. (D) Total abundance of major synovial cell types in each condition. (E) Global gene expression across conditions from pseudo-bulk analysis of scRNA-seq data of all synovial cells. (F) River plot from CellChat analysis showing outgoing signaling patterns from major synovial cell types and the pathways comprising each pattern (contribution score for each pathway is shown on the right). ACLR: anterior cruciate ligament rupture (injury model).
