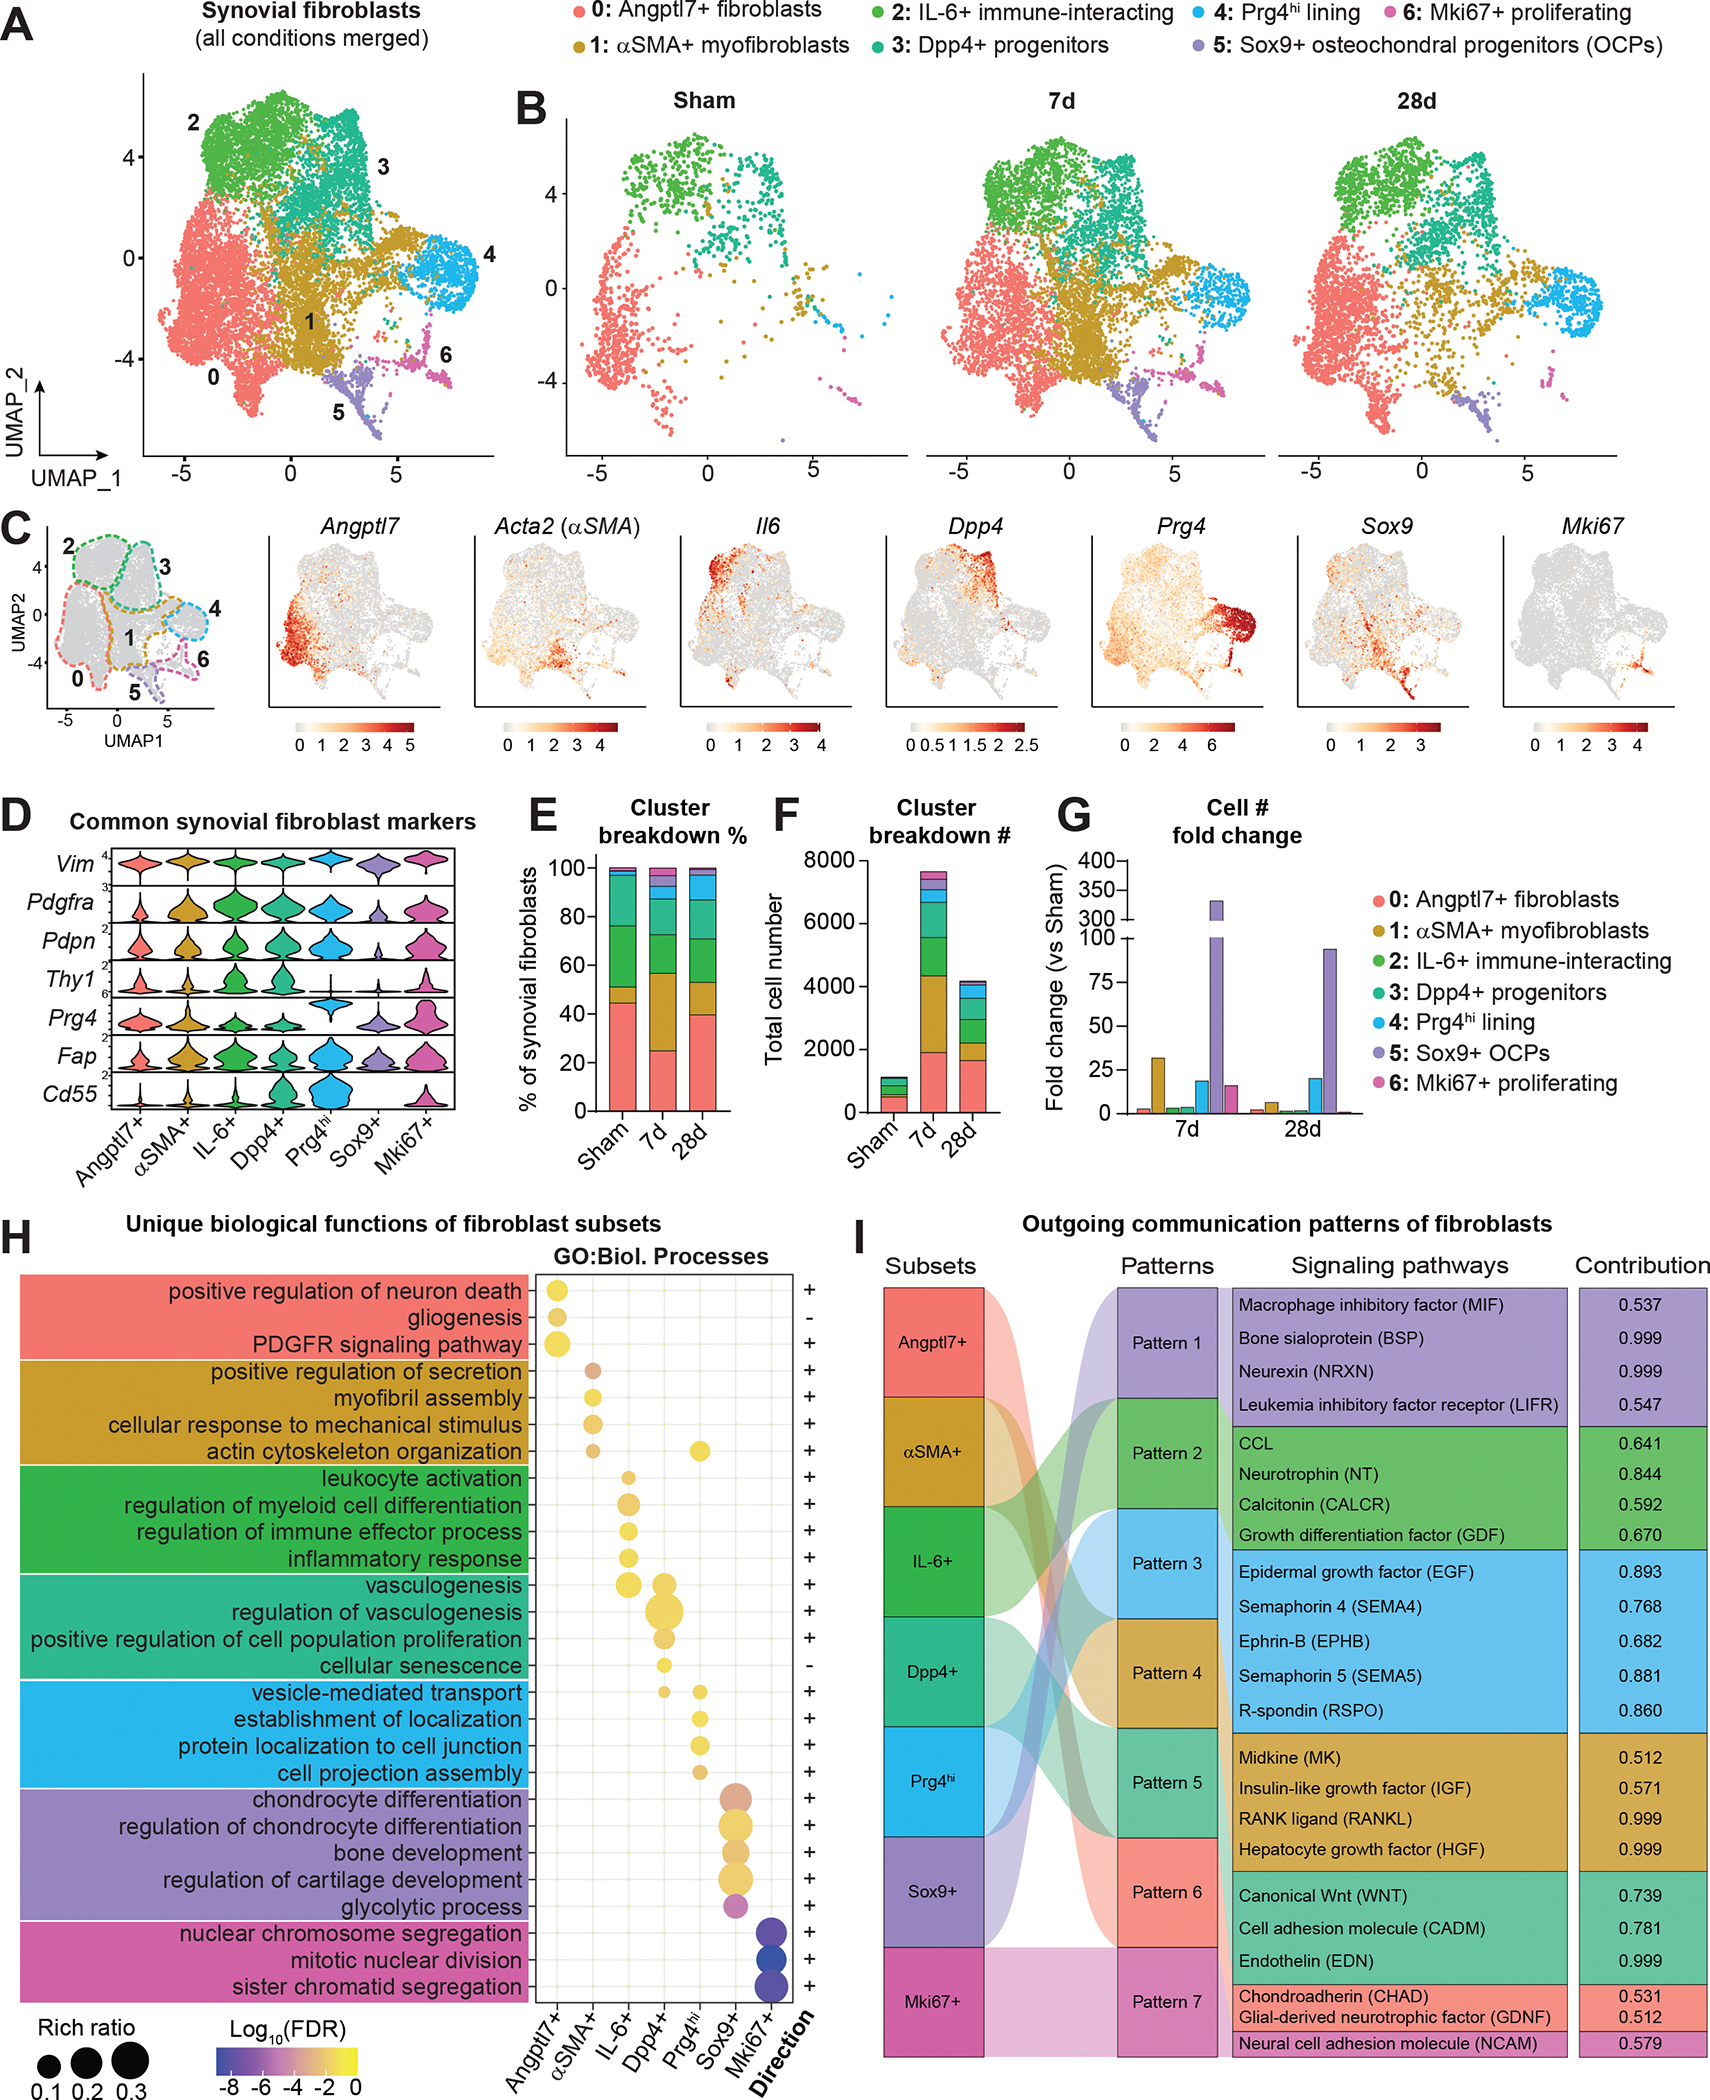
Figure 2. Identification of functionally distinct synovial fibroblast subsets.

(A) UMAP plot showing SFs and related cell types integrated across conditions using canonical correlation analysis (n=2 biological replicates per condition, as in Figure 1). Clusters have designated numbers and colors corresponding to their annotation (top). (B) SF UMAP plots split by condition. (C) UMAP plot of SFs showing cluster borders with colored, dashed outlines (left), and feature plots of marker genes used to designate the naming of each cluster. Color scales represent relative expression for each gene individually. (D) Violin plots showing expression levels of common SF marker genes across clusters. (E) Proportional breakdown (%) of each cluster across condition. (F) Total abundance (#) of cells in each cluster across conditions. (G) Fold change (relative to Sham) of cell number (#) in each cluster at 7d and 28d ACLR. (H) Pathway analysis using Gene Ontology (GO) Biological Processes showing unique functional terms for each cluster and the direction of each term. (I) River plot showing CellChat analysis of outgoing signaling patterns from SF subsets and the pathways comprising each pattern, and the contribution score of each pathway on the right. FDR: false discovery rate.
