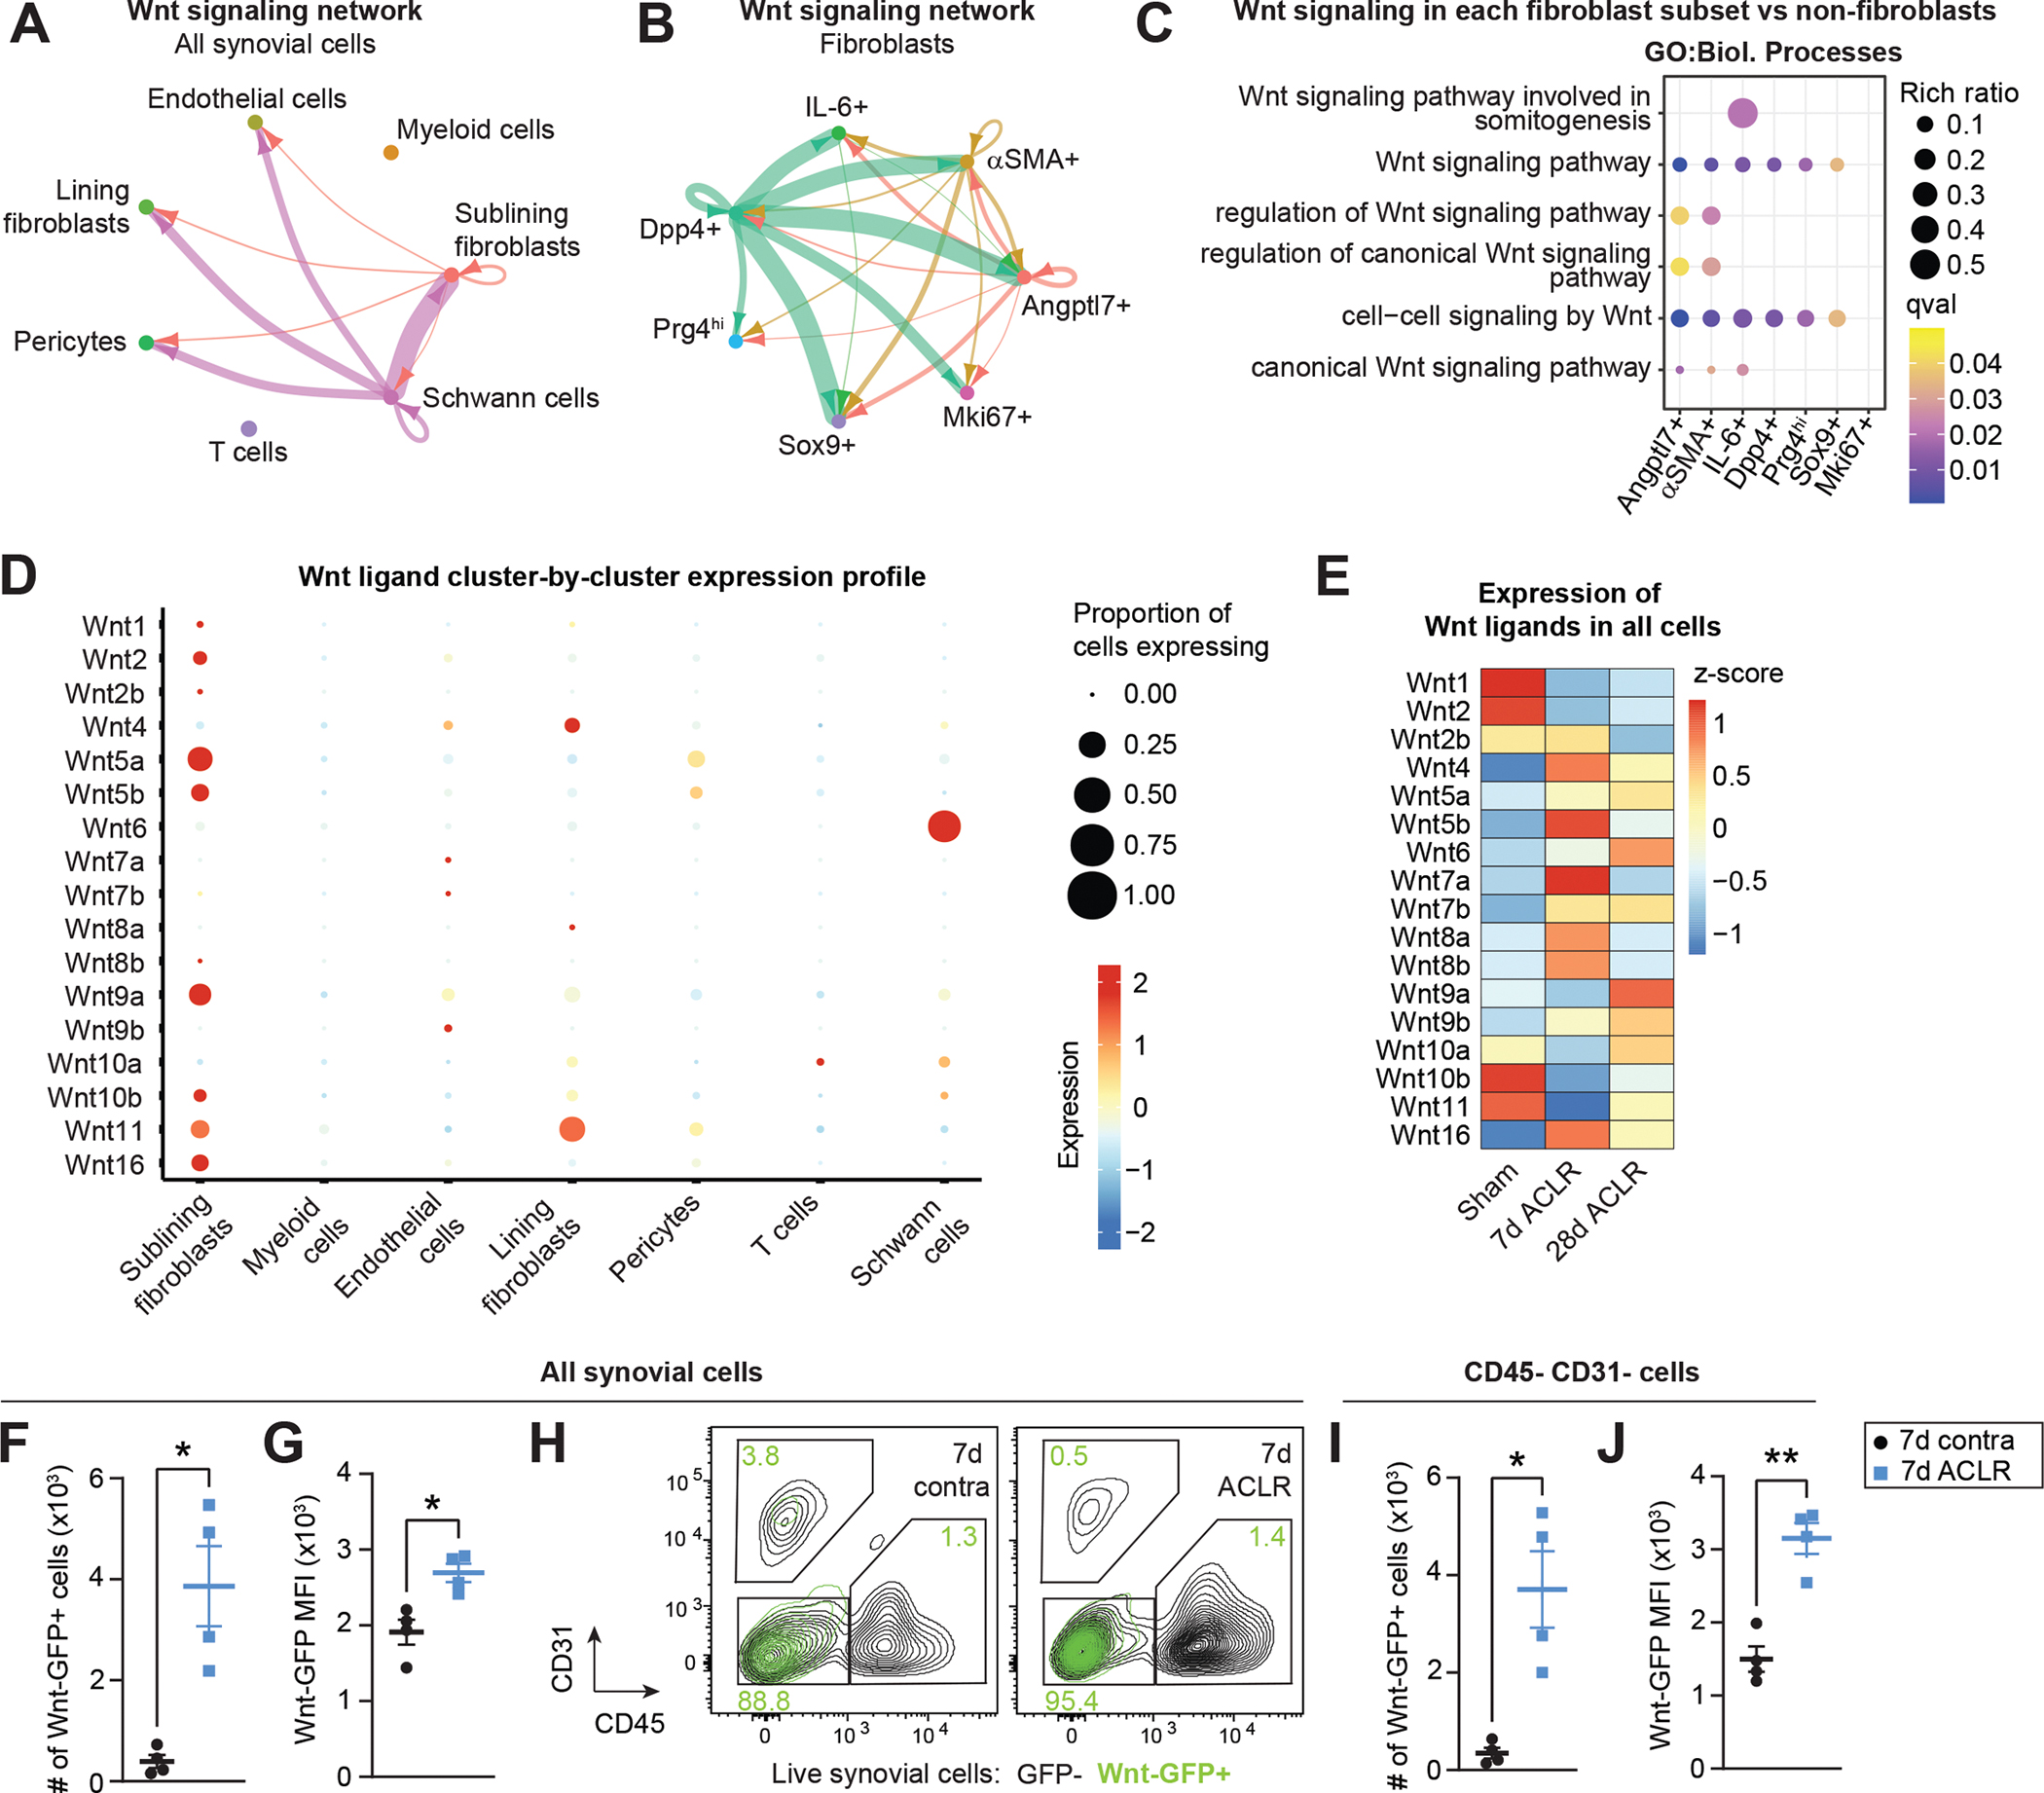
Figure 3. Canonical Wnt/β-catenin signaling is activated in synovium during PTOA.

(A-B) Circle plots showing canonical Wnt signaling communication between all synovial cell types (A) or SFs only (B), with directionality indicated by arrowheads. Lines are color-coded by source cell type and line width is proportional to interaction strength. (C) Pathway analysis using GO Biological Processes showing enriched canonical Wnt signaling terms in each SF cluster compared to all non-SFs. (D) Bubble plot showing expression levels of each Wnt ligand gene across major synovial cell types, and the proportion of cells in each cluster expressing the gene. Some Wnt ligand genes were not detected. (E) Heatmap showing Wnt ligand gene expression (z-score) in all synovial cells from Sham, 7d ACLR or 28d ACLR conditions. (F-J) Flow cytometry assessment of injured or contralateral (contra) synovium from Wnt-GFP reporter mice 7d ACLR (n=4 mice). (F) Total number of Wnt-GFP+ synovial cells. (G) Median fluorescence intensity (MFI) of GFP for all synovial cells. (H) Overlay of Wnt-GFP+ cells (green) from contra and 7d ACLR synovium showing their expression of CD31 and CD45. CD31− CD45− cells represent predominantly SFs in synovium. Green values represent the percentage of Wnt-GFP+ cells in each gate. (I) Total number of CD31− CD45− synovial cells that were Wnt-GFP+. (J) MFI of GFP for CD31− CD45− synovial cells. Paired two-tailed student’s t-tests were used for F, G, I, and J, where *P<0.05, **P<0.01. Error bars are mean ± SEM. qval: P value adjusted for false discovery rate.
