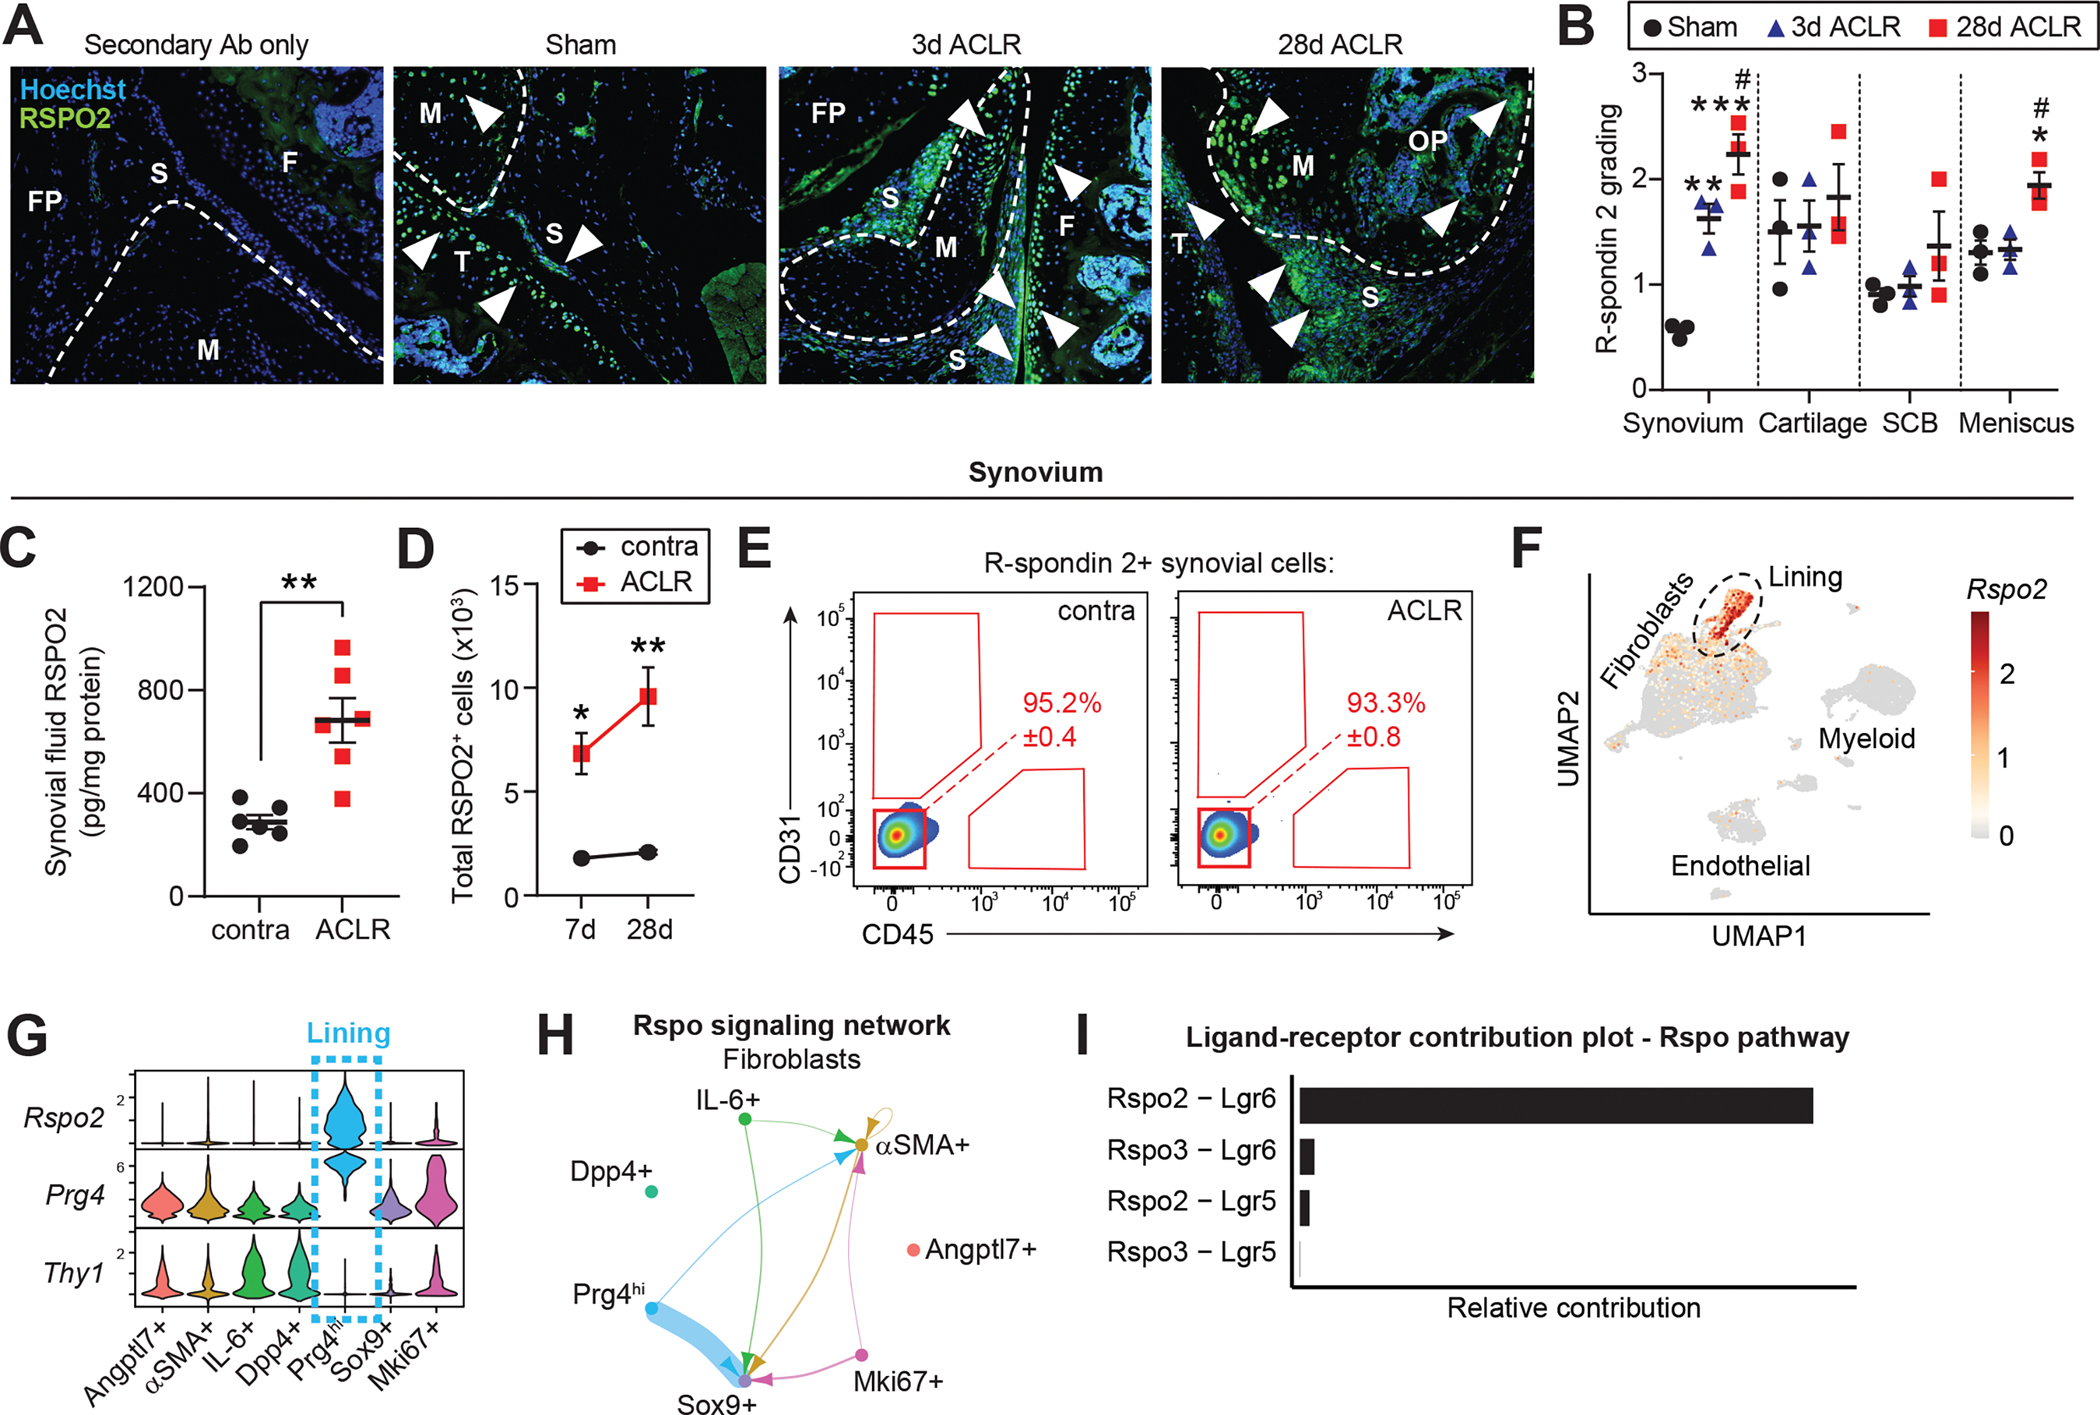
Figure 4. The canonical Wnt agonist R-spondin 2 is strongly and selectively induced during PTOA.

(A) Immunofluorescent staining of R-spondin 2 (RSPO2) in joint sections from Sham, 3d or 28d ACLR. A negative control with only secondary antibody (Ab) staining is included (left). Nuclei were counterstained with Hoechst 33342. White arrowheads indicate areas of RSPO2 expression. Representative images are shown from n=3 mice per condition. FP: fat pad; S: synovium; F: femur; T: tibia; M: meniscus; OP: osteophyte. (B) Qualitative grading of RSPO2 staining in (A) for synovium, cartilage, subchondral bone (SCB), and meniscus. (C) RSPO2 protein levels in synovial fluid from contralateral (contra) and 28d ACLR (n=6 mice), measured by ELISA. Amount of RSPO2 was normalized to total protein in each synovial fluid sample. (D-E) Assessment of RSPO2+ cells from contra, 7d ACLR or 28d ACLR synovium by flow cytometry (n=3 mice per condition). (D) Total number of RSPO2+ cells in synovium. (E) Expression of CD31 and CD45 in RSPO2+ synovial cells. Mean percentage of RSPO2+ cells in the CD31− CD45− gate is shown in red ± SEM. (F) Feature plot showing expression of Rspo2 in all synovial cells by scRNA-seq. Lining SFs are outlined. (G) Violin plots of Rspo2, the sublining SF marker Thy1, and the lining marker Prg4 across SF subsets. (H) Circle plot showing Rspo signaling communication between SF subsets, with directionality indicated by arrowheads. Lines are color-coded by source cell type and line width is proportional to interaction strength. (I) Relative contribution of Rspo pathway ligand-receptor pairs for the circle plot of SFs in (H). For (B), one-way ANOVA with multiple comparisons and Tukey’s post-hoc correction was used to assess significance in each tissue compartment (*P<0.05, **P<0.01, ***P<0.001 compared to Sham; #P<0.05 compared to 3d ACLR). For (C), a paired two-tailed student’s t-test was used with **P<0.01. For (D), a two-way ANOVA with multiple comparisons and Tukey’s post-hoc correction was used, where *P<0.05, **P<0.01 compared to the corresponding contralateral. For B-D, error bars are mean ± SEM.
