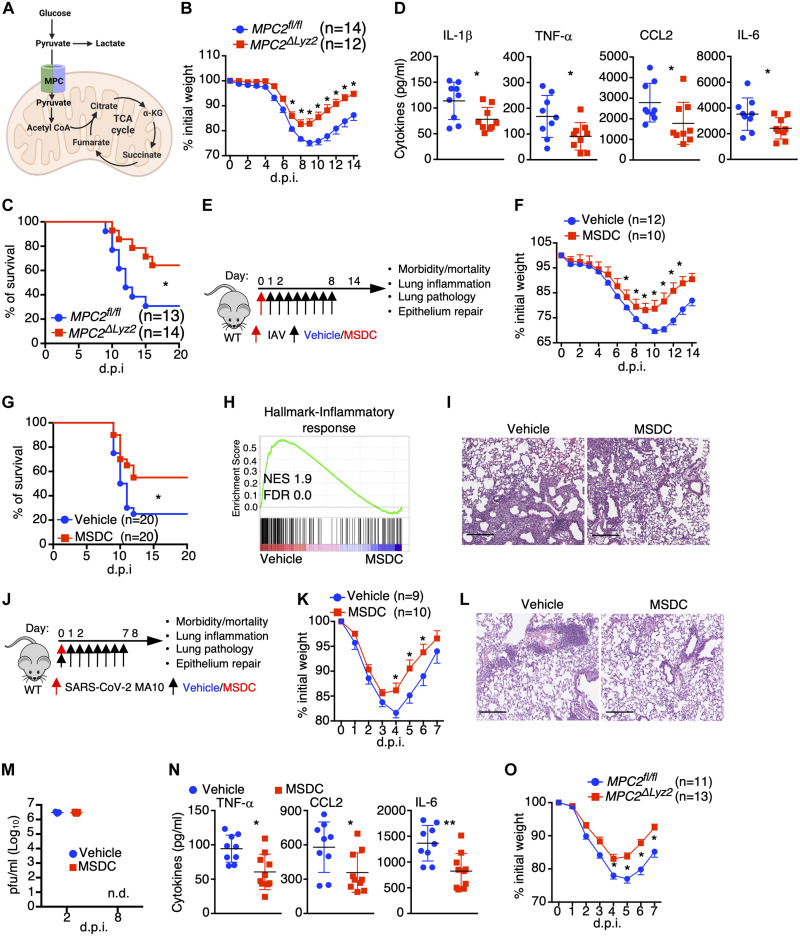
Fig. 1. Disruption of MPC-mediated oxidative pyruvate metabolism mitigates IAV- or SARS-CoV-2-induced pathogenesis.
(A) Diagram of pyruvate metabolic pathways. (B to D) MPC2fl/fl and MPC2ΔLyz2 mice were infected with sub-lethal (B and D) and lethal (C) doses of IAV, respectively. Host morbidity (B) and mortality (C) were monitored. (D) BAL cytokine levels at 4 d.p.i. (n = 9). (E) Schematic diagram for viral infected C57BL/6 WT mice with vehicle or MSDC-0602 k (MSDC) treatment. (F to I) Mice were infected with sub-lethal (F, H, and I) and lethal (G) doses of IAV. Host morbidity (F) and mortality (G) were monitored. (H) RNA-seq analysis of lungs at 4 d.p.i. (n = 3). GSEA of inflammatory response gene set shown. (I) H&E staining of lung section (n = 4–5) at 14 d.p.i. Scale bar, 200 μm (I). (J to N) Mice were infected with SARS-CoV-2 MA10 virus. (J) Schematic diagram for viral infected C57BL/6 WT mice with vehicle or MSDC treatment. (K) Host morbidity was monitored. (L) H&E staining of lung section (n = 5) at 8 d.p.i. Scale bar, 200 μm. (M) BAL viral titers were measured at the indicated time points (n = 5). n.d., not detected. (N) BAL cytokine levels at 8 d.p.i. (n = 9–10). (O) MPC2fl/fl and MPC2ΔLyz2 mice were infected with SARS-CoV-2 MA10. Host morbidity was monitored. Representative (I and L) or pooled data (B, C, D, F, G, K, N and O) from at least two independent experiments. Data are presented as means ± SEM. *, p < 0.05; **, p < 0.01; ***, p < 0.001. The p value was determined by multiple t-tests (B, F, K and O), Logrank test (C and G) or a two-tailed Student’s t-test (D, M and N).

