FIG 1.
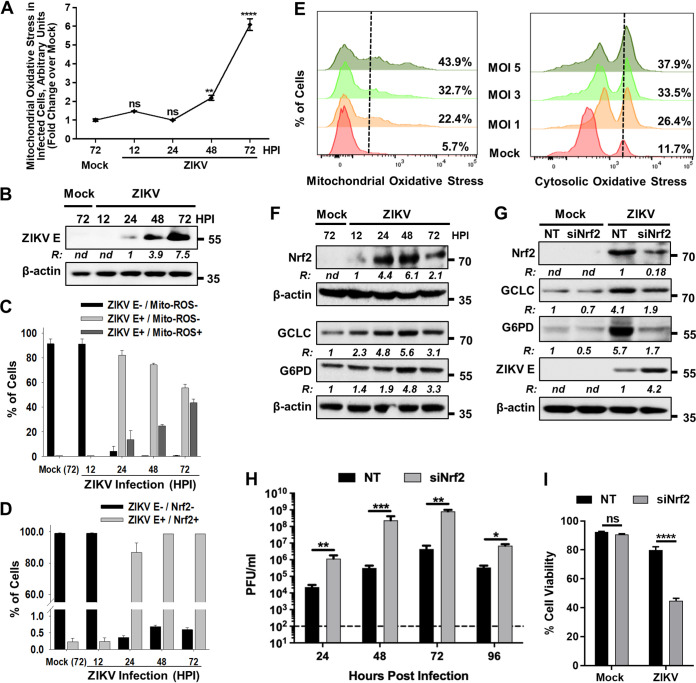
Nrf2 activation antagonizes ZIKV replication. (A) A172 cells were mock infected or infected with ZIKV at an MOI of 1, and changes in the steady-state levels of ROS were determined by flow cytometry at the indicated hours postinfection (hpi) following staining of the cells with MitoSOX red. Data from three independent experiments are shown with fold increases in fluorescence intensity over mock-infected sample at 72 hpi. ns, nonsignificant; ****, P ≤ 0.0001. (B) A172 cells were either mock infected or infected with ZIKV at an MOI of 1, and cell lysates prepared at the indicated hpi were subjected to immunoblotting to detect ZIKV E protein and β-actin. A representative Western blot image from three independent experiments is shown with the ratios (R) of the viral E protein to β-actin presented between the blots. nd, not determined. The numbers on right represent the electrophoretic mobility of molecular mass markers in kilodaltons (kDa). (C) Cells mock infected or infected with ZIKV as in panel A were costained at the indicated hpi with ZIKV E antibody and MitoSOX red (Mito-ROS) and subjected to flow cytometry. The percentage of cells showing viral infection and ROS from three independent experiments is presented. Error bars represent the ±SEM. (D) Cells mock infected or infected with ZIKV as in panel A were costained at the indicated hpi with ZIKV E and Nrf2 antibodies and subjected to flow cytometry. The percentage of cells showing viral infection and Nrf2 expression from three independent experiments is presented. Error bars represent the ±SEM. (E) Examination of mitochondrial ROS levels using MitoSOX red (left panel) and cytosolic ROS levels using DHE (right panel) induced in LUHMES cells infected with various MOIs of ZIKV. The percent positive cells exhibiting steady-state levels of ROS at 72 hpi is shown in the panels for each MOI. (F) Detection of Nrf2 in mock- and ZIKV-infected A172 cells at various hpi. Cells were infected as in panel B, and cell lysates were examined by immunoblotting to detect Nrf2, GCLC, G6PD, and β-actin with the respective antibodies. Representative Western blots from three independent experiments are shown, with the ratios (R) of the proteins to β-actin presented at the bottom of the corresponding blots. nd, not determined. The numbers on right represent electrophoretic mobility of molecular mass markers in kDa. (G) A172 cells were transfected with either nontargeting (NT) or Nrf2 siRNA (siNrf2) for 48 h. The cells were subsequently mock infected or infected with ZIKV at an MOI of 1. Cell lysates prepared at 48 hpi were subjected to immunoblotting to detect Nrf2, GCLC, G6PD, ZIKV E protein, and β-actin using the respective antibodies. Representative images from three independent experiments are shown, with the ratios (R) of the proteins to β-actin presented at the bottom of the corresponding blots. nd, not determined. The electrophoretic mobility of molecular mass markers in kDa is shown on the right. (H) Infectious virus titers in NT or Nrf2 siRNA-treated cells at various hpi. Data from four independent experiments are shown. The horizontal dashed line represents the limit of detection. Error bars represent the ±SEM. *, P ≤ 0.05; **, P ≤ 0.01; ***, P ≤ 0.001. (I) Effect of siRNA-mediated depletion of Nrf2 on ZIKV-induced cell viability at 96 hpi. A172 cells were infected as described in panel H, and cell viability was determined as described in Materials and Methods. Data from three independent experiments are shown with error bars representing the ±SEM. ns, nonsignificant; ****, P ≤ 0.0001.

