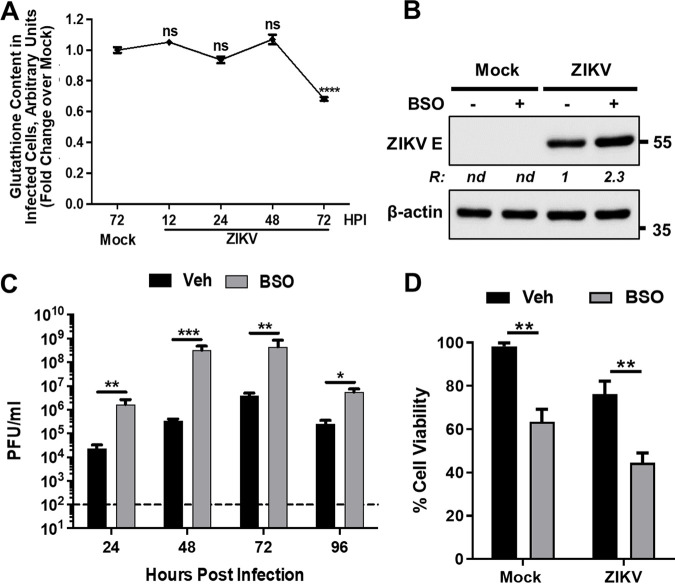
FIG 2.
Inhibition of glutathione synthesis enhances ZIKV replication. (A) A172 cells were mock infected or infected with ZIKV at an MOI of 1, and cellular GSH content at the indicated hpi was determined by flow cytometry. Data from three independent experiments are shown with the fold change over mock-infected sample at 72 hpi. The error bars show the ±SEM. ns, nonsignificant; ****, P ≤ 0.0001. (B) A172 cells were treated with either vehicle (–) or BSO (+) prior to being mock infected or infected with ZIKV at an MOI of 1 in the continued presence of BSO. Cell lysates prepared at 48 hpi were subjected to immunoblotting to detect ZIKV E protein and β-actin with the respective antibodies. Representative images from three independent experiments are shown. The ratio (R) of the viral E protein to β-actin is shown between the blots. nd, not determined. The electrophoretic mobility of molecular mass markers in kDa is shown on the right. (C) Infectious virus titers in vehicle (veh) or BSO-treated and infected cells at various hpi. Data from four independent experiments are shown. The horizontal dashed line represents the limit of detection. The error bars show the ±SEM. *, P ≤ 0.05; **, P ≤ 0.01; ***, P ≤ 0.001. (D) Effect of BSO on ZIKV-induced cell viability at 96 hpi. The experiment was conducted as described in panel C, and data from three independent experiments are shown with error bars representing the ±SEM. **, P ≤ 0.01.

