FIG 4.
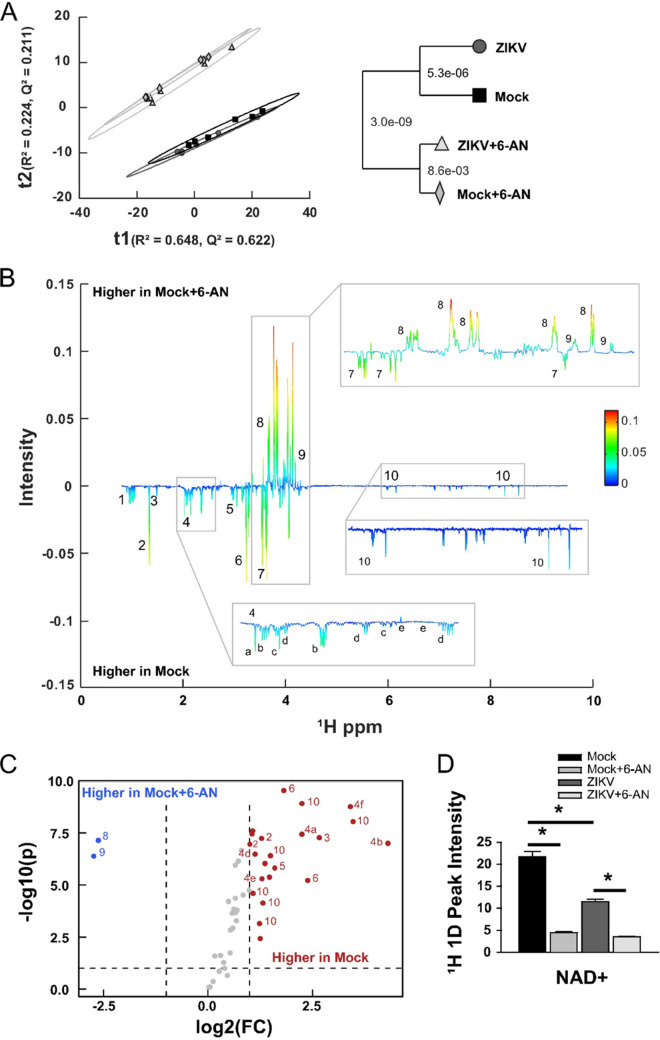
1H 1D NMR metabolomics analysis. (A) PCA model of mock (black square), mock plus 6-AN (light gray diamond), ZIKV (dark gray circle), and ZIKV plus 6-AN (cream triangle) samples 48 h after ZIKV exposure and 24 h after 6-AN treatment. R2 = 0.872 and Q2 = 0.833. The model dendrogram depicts the first 4 components with Mahalanobis distances displayed as P values. (B) Back-scaled loading plot comparing mock versus mock plus 6-AN. This plot was generated from a valid OPLS model with a CV-ANOVA P value of 2.6677e-05. Positive values depict metabolites that are higher in mock plus 6-AN samples, while negative values depict metabolites whose concentration is higher in mock samples. (C) Volcano plot for mock versus mock plus 6-AN metabolites with a fold change (FC) threshold (x axis) of log2 and t test threshold (y axis) of 0.1. Blue circles represent metabolites significantly increased in mock plus 6-AN samples, and red circles represent metabolites significantly enriched in mock samples. (D) Bar chart quantifying NAD+ metabolites. Data in graphs are presented as changes in spectrum intensity and are the means ± SEM of n = 6 replicates. *, P ≤ 0.05. Metabolites observed in panels B and C are numbered as follows: (1) branched-chain amino acids (isoleucine, leucine, and valine), (2) threonine and lactate, (3) alanine, (4) TCA-derived metabolites ([a] N-acetylglutamate, [b] glutamate, [c] methionine, [d] glutathione, [e] aspartic acid, [f] glutamine), (5) creatine and phosphocreatine, (6) choline metabolites, (7) myo-inositol, (8) gluconolactone, (9) 6-phosphogluconic acid, (10) energy metabolites (NAD[H], GDP, UDP, and UDPG).

