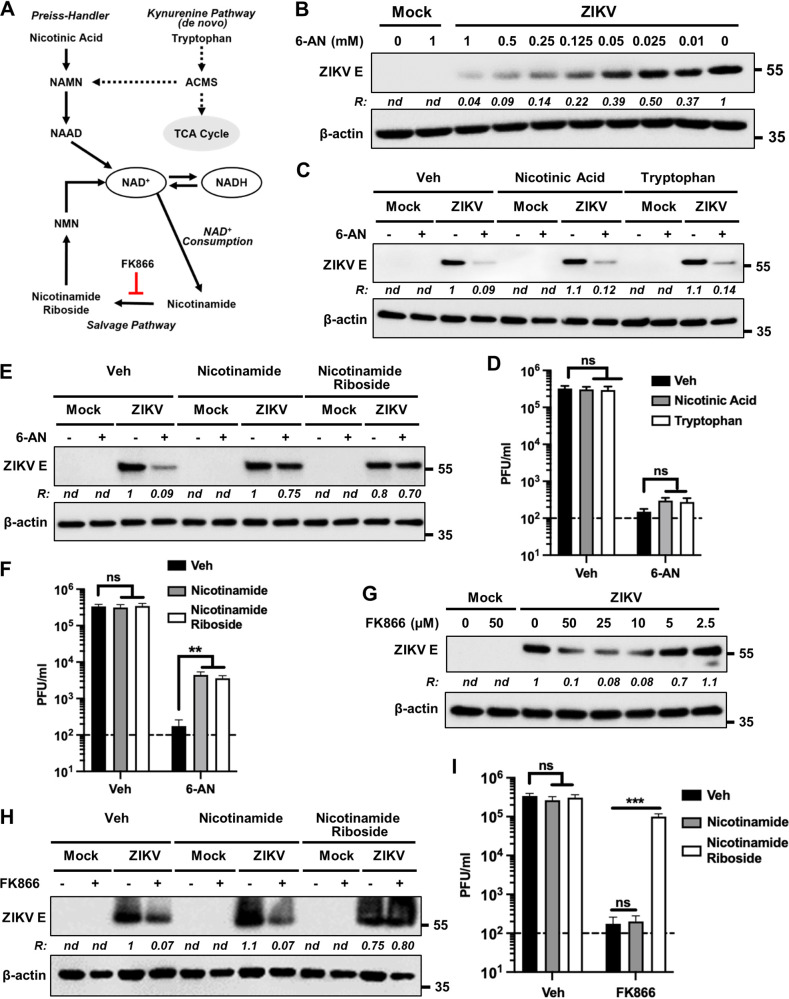
FIG 5.
NAD precursors rescue the inhibitory effects of 6-AN on ZIKV replication. (A) Schematic showing the different pathways leading to the synthesis and/or recycling of NAD/NADH. FK866 inhibits the conversion of nicotinamide to nicotinamide riboside. ACMS, α-amino-β-carboxymuconate-ε-semialdehyde; NAMN, nicotinic acid mononucleotide; NAAD, nicotinic acid adenine dinucleotide; NMN, nicotinamide mononucleotide. (B) Dose-response inhibition of E protein accumulation in ZIKV-infected cells by 6-AN. A172 cells were either mock infected or infected with ZIKV at an MOI of 1 and treated without or with various concentrations of 6-AN as shown on top of each lane. Cell lysates prepared at 48 hpi were subjected to immunoblotting to detect the viral E protein and β-actin using the corresponding antibodies. The ratio (R) of ZIKV E protein to β-actin is shown between the blots. nd, not determined. The numbers on the right represent the electrophoretic mobility of molecular mass markers in kDa. (C) A172 cells were either mock infected or infected with ZIKV at an MOI of 1 and treated without (–) or with (+) 130 μM 6-AN. Additionally, the cells were treated with either vehicle control (veh), nicotinic acid (300 μM), or tryptophan (300 μM). Cell lysates prepared at 48 hpi were subjected to immunoblotting to detect ZIKV E protein and β-actin using the corresponding antibodies. Representative images from three independent experiments are shown. The ratio (R) of ZIKV E protein to β-actin is shown between the blots. nd, not determined. The numbers on the right represent the electrophoretic mobility of molecular mass markers in kDa. (D) Infectious virus titers in vehicle- or 6-AN-treated cells along with either nicotinic acid or tryptophan. Data from four independent experiments are shown. The horizontal dashed line represents the limit of detection. Error bars represent the ±SEM. ns, non-significant. (E and F) The experiments were conducted as described in panels C and D above except that nicotinamide (300 μM) and nicotinamide riboside (300 μM) were used. Representative Western blot images from three independent experiments are shown in panel E, and data from four independent experiments are shown in panel F. ns, nonsignificant; **, P ≤ 0.01. (G) A172 cells were either mock infected or infected with ZIKV at an MOI 1 and treated with the indicated concentrations of FK866. Cell lysates prepared at 48 hpi were subjected to immunoblotting to detect ZIKV E protein, and β-actin. Representative images from three independent experiments are shown. The ratio (R) of ZIKV E protein to β-actin is shown between the blots. nd, not determined. The numbers on the right represent the electrophoretic mobility of molecular mass markers in kDa. (H) A172 cells were either mock infected or infected with ZIKV at an MOI of 1 and treated without (–) or with (+) a 50-μM concentration of FK866. Cells were also immediately treated without (veh) or with 300-μM concentrations of either nicotinamide or nicotinamide riboside as shown on top of the lanes. Cell lysates prepared at 48 hpi were subjected to immunoblotting to detect ZIKV E protein and β-actin. Representative images are shown. The ratio (R) of ZIKV E protein to β-actin is shown between the blots. nd, not determined. (I) The experiment was conducted as in panel D, and infectious virus yield in the supernatants was assayed at 48 hpi. Data from three independent experiments are shown. The horizontal dashed line represents the limit of detection. Error bars represent the ±SEM. ns, nonsignificant; ***, P ≤ 0.001.

