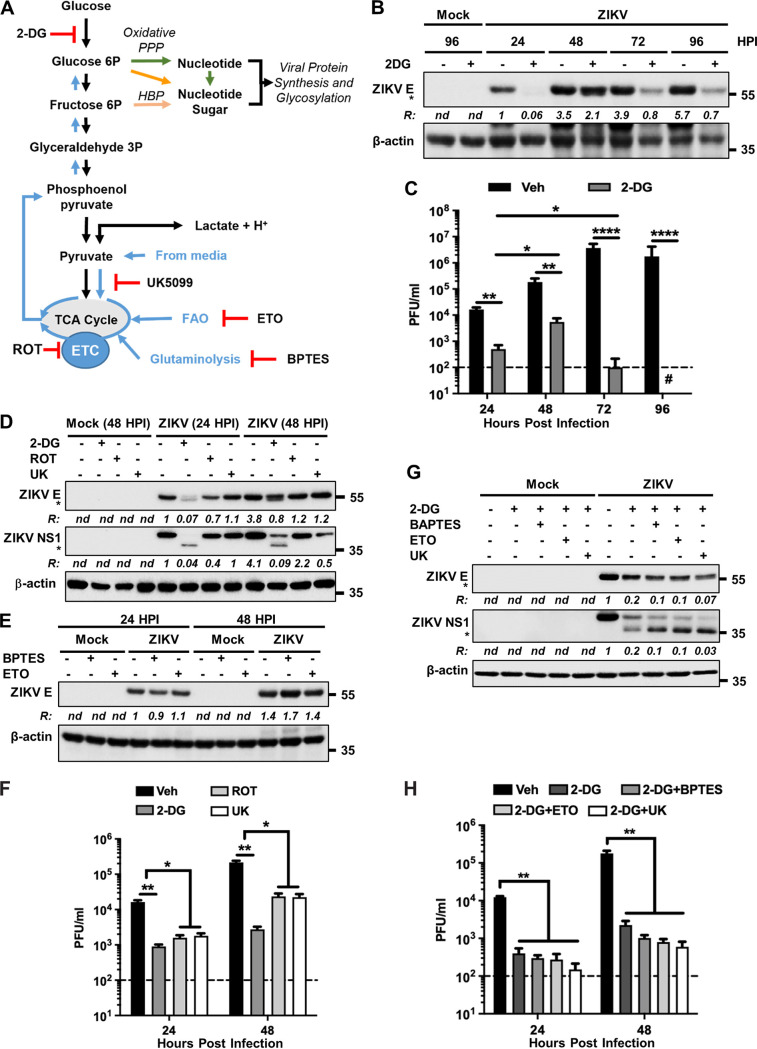
FIG 8.
Glycolysis and mitochondrial metabolism are necessary for ZIKV protein expression and glycosylation. (A) Scheme showing glycolysis and mitochondrial metabolism. UK5099 (UK) inhibits the entry of pyruvate into the TCA cycle, ETO inhibits FAO, and BPTES inhibits glutaminolysis. Other inhibitors (2-DG and ROT) with their sites of action are described in the legend to Fig. 7. (B) A172 cells were either mock infected or infected with ZIKV at an MOI of 1 and treated without (–) or with (+) 2-DG. Cell lysates prepared at the indicated hpi were subjected to immunoblotting to detect ZIKV E protein and β-actin. Representative images from three independent experiments are shown. Note that the E protein is seen as a closely migrating doublet in the presence of 2-DG, representing the glycosylated (upper band) and the nonglycosylated (bottom band, identified with an asterisk) species. The ratio (R) of ZIKV E protein (both bands) to β-actin is shown between the blots. nd, not determined. The numbers on the right represent the electrophoretic mobility of molecular mass markers in kDa. (C) Infectious virus titers at various hpi in vehicle (veh)-or 2-DG-treated cells as described in panel B. The horizontal dashed line represents the limit of detection. Data from three independent experiments are shown with error bars representing the ±SEM. *, P ≤ 0.05; **, P ≤ 0.01; ****, P ≤ 0.0001. (D) A172 cells were either mock infected or infected with ZIKV at an MOI of 1 and treated with either 2-DG, ROT, or UK. Cell lysates prepared at the indicated hpi were subjected to immunoblotting to detect ZIKV E protein, NS1 protein, and β-actin. Note that the upper bands in the E and NS1 blots represent the glycosylated proteins, whereas their unglycosylated forms (lower bands) are identified with asterisks. Representative images from three independent experiments are shown. The ratio (R) of ZIKV E or NS1 proteins (both bands) to β-actin is shown below the respective blots. nd, not determined. The numbers on the right represent the electrophoretic mobility of molecular mass markers in kDa. (E) The experiment was conducted and the data are presented in a similar manner to that described in panel D but using only BPTES and ETO as inhibitors. (F) Infectious virus titers from cells treated with no drug (veh), 2-DG, ROT, or UK. The horizontal dashed line represents the limit of detection. Data from four independent experiments are shown with error bars representing the ±SEM. *, P ≤ 0.05; **, P ≤ 0.01. (G) A172 cells were either mock infected or infected with ZIKV at an MOI of 1 and treated without (–) or with (+) 2-DG. Additionally, the cells were treated with either BPTES, ETO, or UK. Cell lysates prepared at 48 hpi were subjected to immunoblotting to detect ZIKV E protein, NS1 protein, and β-actin. The unglycosylated forms of E and NS1 are identified with asterisks in the respective blots. Representative images from three independent experiments are shown. The ratio (R) of ZIKV E or NS1 proteins (only the top band) to β-actin is shown below the respective blots. nd, not determined. The numbers on the right represent the electrophoretic mobility of molecular mass markers in kDa. (H) Infectious virus titers from cells treated with vehicle control or with 2-DG and either BPTES, ETO, or UK. The horizontal dashed line represents the limit of detection. Data from four independent experiments are shown with error bars representing the ±SEM. **, P ≤ 0.01.

