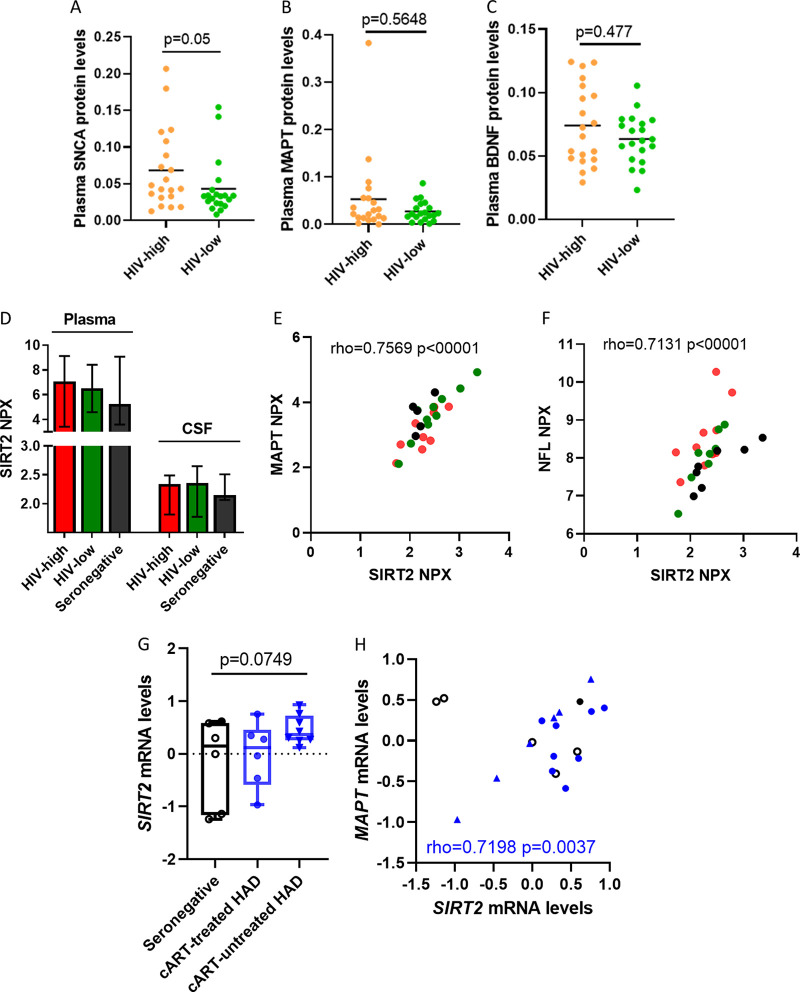
FIG 3.
SIRT2 levels in the CNS of HIV-infected individuals. (A to C) Scatterplot showing the relative plasma protein levels of SNCA (A), MAPT (B), and BDNF (C) in both study groups (HIV-high [n = 20, orange dots] and HIV-low [n = 20, green dots]). (D) Plot representing normalized protein expression (NPX) levels of SIRT2 in the plasma (left) and CSF (right) in HIV-high (n = 10, red bar), HIV-low (n = 10, green bar), and seronegative individuals (n = 5, black bar). The mean and standard deviation are shown. (E and F) Correlation between relative SIRT2 levels and relative CSF levels of MAPT (E) and NFL (F) in HIV-high (n = 10, red dots), HIV-low (n = 10, green dots), and seronegative individuals (n = 5, black dots). Relative MAPT and NFL levels are shown on the y axis, and relative SIRT2 levels are shown on the x axis. (G) Plot representing SIRT2 gene expression in postmortem brain tissues measured by microarray in the GSE28160 study performed in seronegative (n = 6), cART-treated HAD (HIV-associated disorders, n = 6), and cART-untreated HAD individuals (n = 8). Values are expressed as mean and standard deviation. (H) Correlation between gene expression levels of SIRT2 (x axis) and MAPT (y axis) in postmortem brain tissue samples in HIV-infected individuals (cART-treated HAD [n = 6] and cART-untreated HAD individuals [n = 8]). For comparisons between groups, ANOVA test for multiple comparisons corrected by original FDR method of Benjamini and Hochberg was applied. The Spearman's rank test was applied for the correlation analysis. Statistical significance was set at P < 0.05.

