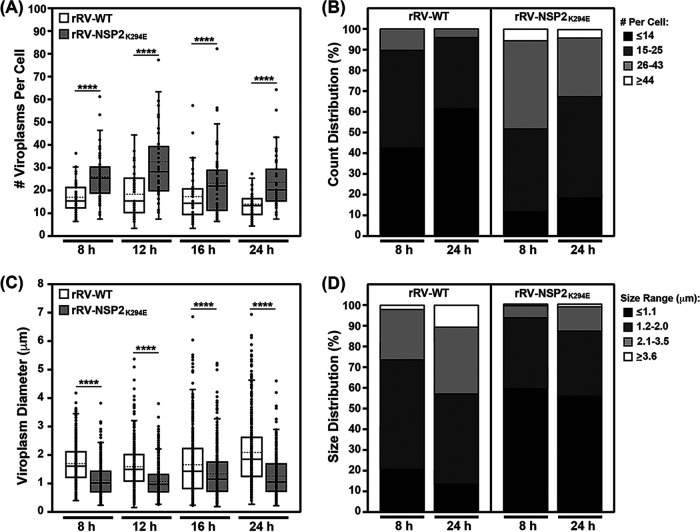
FIG 6.
Quantification of viroplasm number and size. (A) The number of viroplasms per cell for rRV-WT (white) and rRV-NSP2K294E (gray) was quantified in blinded αNSP2-stained micrographs at each time point. The mean is shown as a dashed line, and the median is shown as a solid line in the box-and-whiskers plot. Statistical significance was determined using the negative binomial model. Asterisks (****) indicate a P value of <0.0001. (B) The data for viroplasm numbers at the 8- and 24-h time points were binned using a custom R script. Each bin represents the percentage of cells with the viroplasm numbers according to the legend. (C) The diameter of viroplasms for rRV-WT (white) and rRV-NSP2K294E (gray) was quantified in blinded αNSP2-stained micrographs at each time point. The mean is shown as a dashed line, and the median is shown as a solid line in the box-and-whiskers plot. Statistical significance was determined using the Box-Cox transformation followed by a linear regression. Asterisks (****) indicate a P value of <0.0001. (D) The data for viroplasm diameters at the 8- and 24-h time points were binned using a custom R script. Each bin represents the percentage of cells containing viroplasms with the size range indicated in the legend.

