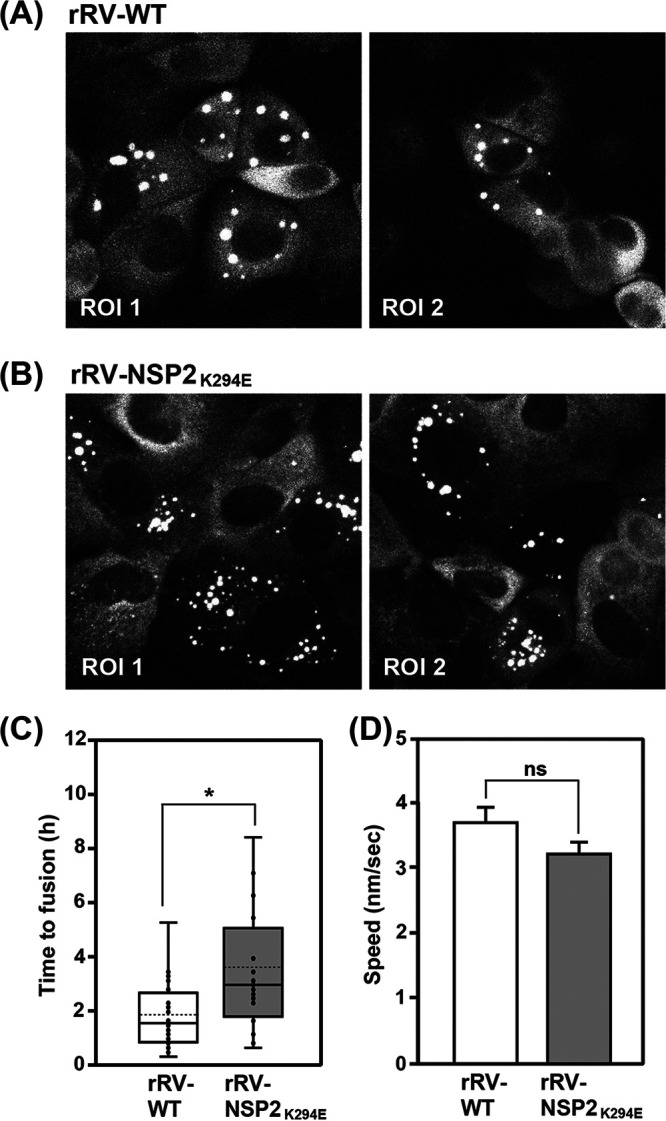
FIG 8.

Live-cell imaging of viroplasms in NSP2WT:mCherry expressing MA104 cells. (A and B) MA104 cells stably expressing NSP2WT:mCherry were infected with rRV-WT (A) or rRV-NSP2K294E (B) at an MOI of 3 PFU per cell for 16 h. Cells were imaged every 10 min using confocal microscopy. Representative still images of two regions of interest (ROI 1 and ROI 2) are shown at 16 h p.i. Viroplasms were tracked as described in Materials and Methods to measure the time to fusion and average speed. (C) Time to fusion. Numbers are shown in hours. The mean is shown as a dashed line, and the median is shown as a solid line in the box-and-whiskers plot. A total of 20 individual fusion events were analyzed for each virus. Statistical significance was determined using a two-tailed, unpaired t test. The asterisk (*) indicates a P value of <0.05. (D) Viroplasm speed. Numbers are shown in nm/s. A total of 90 viroplasms were tracked per virus. Statistical significance was determined using a two-tailed, unpaired t test. Error bars represent the standard error from the mean. ns, not significant.
