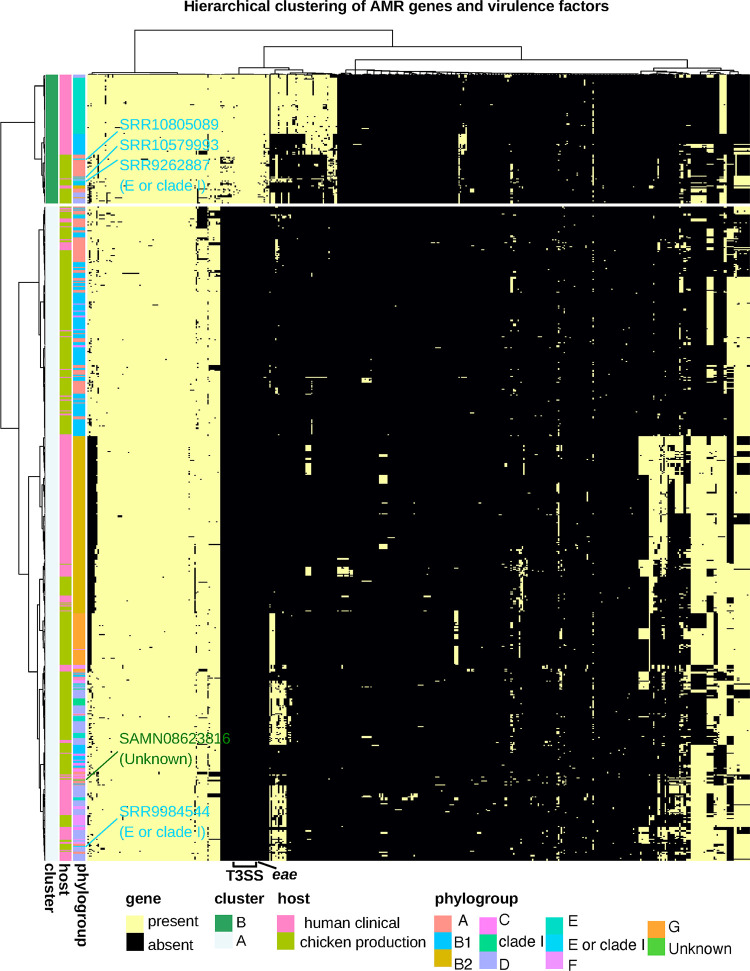
FIG 6.
Heatmap of AMR genes and virulence factors across all isolates (see Table S1). Heatmap was generated in R v4.0.4 with pheatmap v1.0.12 (clustering_method = “average” [UPGMA], clustering_distance_cols = “binary,” clustering_distance_rows = “Euclidean”) using the filtered AMR gene and virulence factor table. Isolates from the phylogroups “unknown” and “E or clade I” are highlighted.

