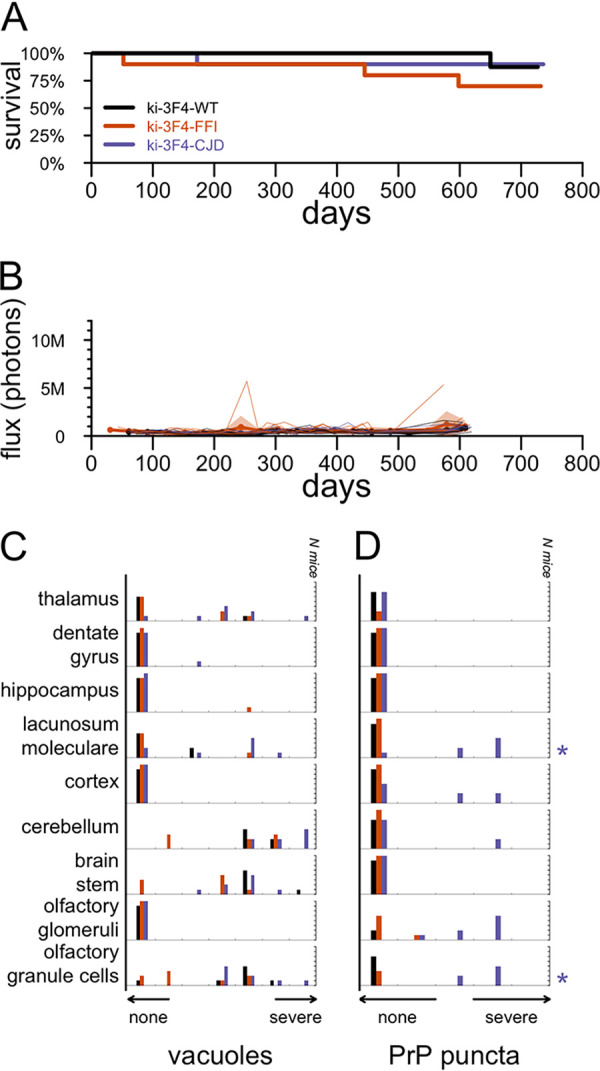
FIG 2.

Candidate endpoints in placebo-treated knock-in mice. (A) All-cause mortality for 10 animals per group through 719 days of age. (B) Bioluminescence trajectories for the same animals. Animals were imaged approximately monthly, and occasionally twice monthly, through approximately 600 days of age. Thin lines indicate individual animal trajectories, thick lines and dots indicate means per week per treatment group, and shaded regions indicate 95% confidence intervals of the means. For ease of comparison to RML prion-infected mice, the y axis scale is the same as that in Fig. 1B. (C and D) Histogram of vacuolization scores (C) and histogram of 3F4 (PrP) punctum scores (D) for 5 to 8 animals per group subjected to histology analysis. Distributions for ki-3F4-FFI and ki-3F4-CJD mice were compared to those for WT mice for each region using Wilcoxon tests, and multiple testing was corrected using false discovery rates. Symbols at the right indicate corrected statistical significance (*, FDR of <5%; **, FDR of <1%) and are color-coded by genotype.
