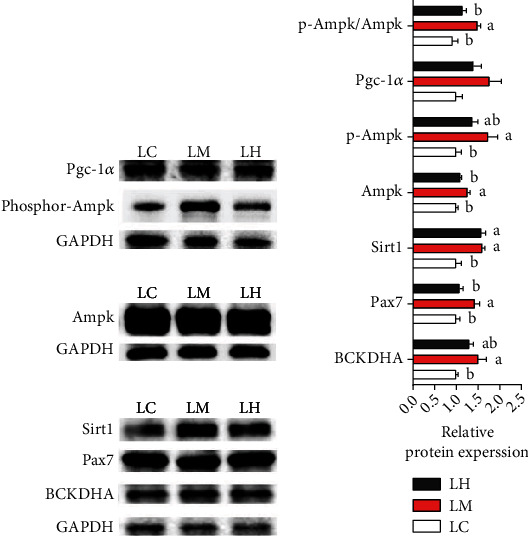
Figure 9.

Western blot analysis of BCKDHA, Ampk, p-Ampk, Sirt1, Pgc-1α, Pax7, and p-Ampk/Ampk in the muscle cells of blunt snout bream cultured in the three medium of leucine levels. Values are represented as mean ± SEM (n = 4) by vertical bars. Mean values with different letters indicate significantly.
