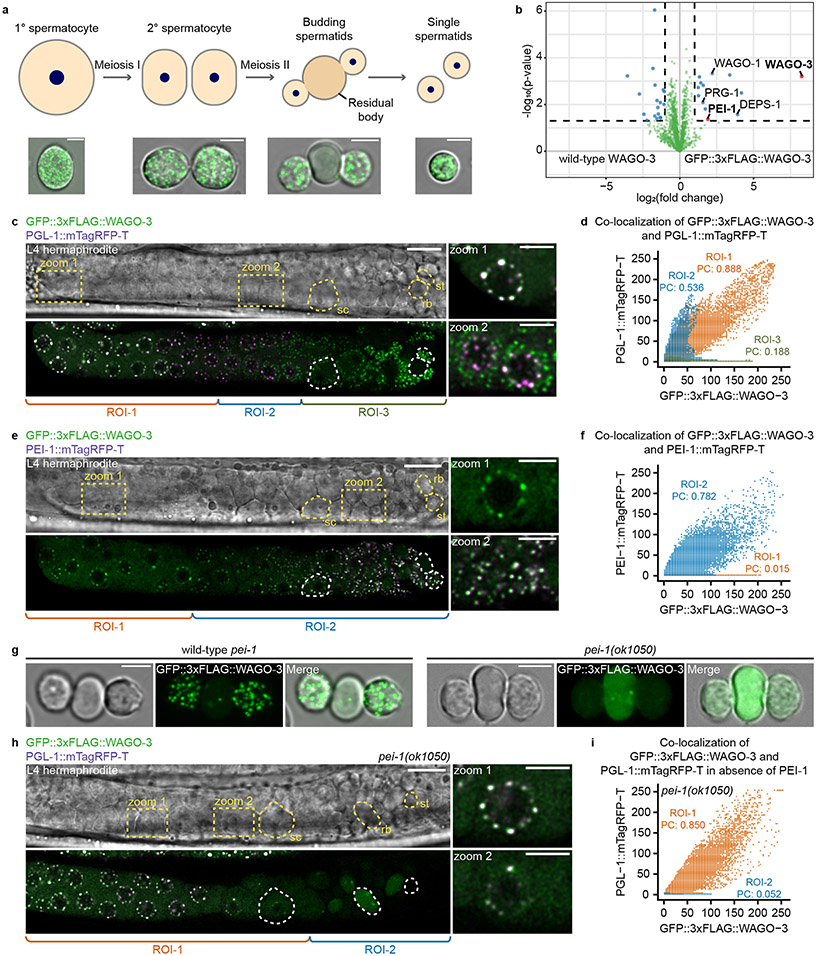
Fig. 1 ∣. WAGO-3 is guided into sperm by PEI-1.
a, Schematic summarizing spermatogenesis in C. elegans. Corresponding confocal images of male-derived cells expressing GFP::3xFLAG::WAGO-3 are shown below. Scale bars: 4μm. b, Volcano plot representing label-free proteomic quantification of quadruplicate GFP::3xFLAG::WAGO-3 immunoprecipitation experiments from late-L4 stage hermaphrodite extracts. The X-axis indicates the mean fold enrichment of individual proteins in the control versus the genome-edited strain. The Y-axis represents −log10(p value) of observed enrichments. Dashed lines show thresholds at p = 0.05 and two-fold enrichment. Blue and green data points represent above and below threshold, respectively. WAGO-3 and PEI-1 are highlighted with red data points. c, Confocal micrograph showing spermatogenesis of late-L4 stage hermaphrodite expressing indicated proteins. PGL-1::mTagRFP-T serves as P granule marker. Germ cell development progresses from left to right. Zoom of two areas is provided. ROI1: PGL-1::mTagRFP-T and GFP::3xFLAG::WAGO-3 co-localize; ROI2: GFP::3xFLAG::WAGO-3 leaves P granules; ROI3: PGL-1::mTagRFP-T signal is not detectable anymore. sc – spermatocyte, rb – residual body, st – spermatid. Scale bars: 10 μm (proximal gonad), 4 μm (zoom). d, Co-localization analysis between GFP::3xFLAG::WAGO-3 and PGL-1::mTagRFP-T based on the image shown in c. Signals from ROI1-3 are plotted in orange, blue and green, respectively. X and Y axes indicate fluorescence intensity. PC: Pearson’s correlation coefficient. e, As c, for PEI-1::mTagRFP-T instead of PGL-1::mTagRFP-T. ROI1: no PEI-1::mTagRFP-T expression. ROI2: PEI-1::mTagRFP-T is expressed. sc – spermatocyte, rb – residual body, st – spermatid. Scale bars: 10 μm (proximal gonad), 4 μm (zoom). f, As d for PEI-1::mTagRFP-T instead of PGL-1::mTagRFP-T. g, Confocal maximum intensity projections of male-derived budding spermatids expressing GFP::3xFLAG::WAGO-3 in presence and absence of PEI-1. Scale bars: 4 μm. h, Confocal micrograph showing spermatogenesis of late-L4 stage hermaphrodite expressing GFP::3xFLAG::WAGO-3 and PGL-1::mTagRFP-T in a pei-1(ok1050) mutant background. Germ cell development progresses from left to right. Zoom of two areas is provided. ROI1: PGL-1::mTagRFP-T is expressed; ROI2: no PGL-1::mTagRFP-T expression detectable. sc – spermatocyte, rb – residual body, st – spermatid. Scale bars: 10 μm (proximal gonad), 4 μm (zoom). i, As d in a pei-1(ok1050) mutant background based on the image shown in h. c,e,g,h, Images represent three biologically independent experiments. Source data are provided.

