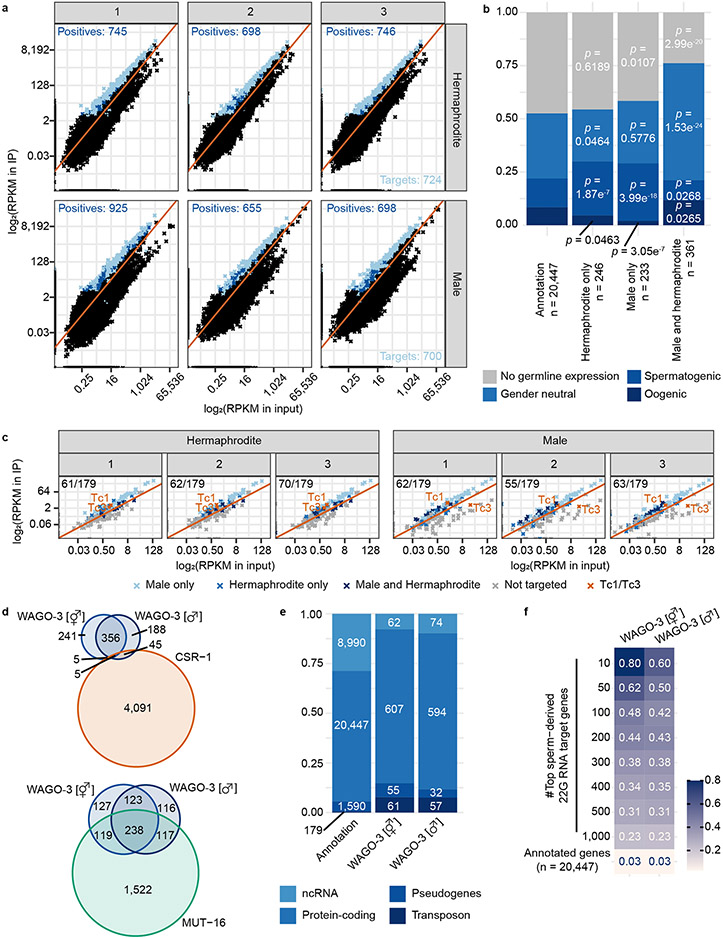
Extended Data Fig. 3. WAGO-3 targets overlap with Mutator targets and sperm-derived 22G RNAs.
a, Scatter plots displaying the RPKM of 22G RNAs mapping to individual genes in immunoprecipitation (IP) (Y-axis) versus input (X-axis) samples for all six sequenced libraries. Transposons are not included in these plots. Light blue: significant enrichment of genes in at least two replicates. Dark blue: significant enrichment of genes in only one replicate. b, Germline expression status of protein-coding WAGO-3 target genes. Left column shows the distribution of expression profiles of all annotated protein-coding genes. Columns 2 and 3 show the same, but for hermaphrodite and male-specific WAGO-3 targets, respectively. Column 4 shows the same for targets found in both sexes. Statistically significant differences with respect to complete gene annotations were determined by Chi-square tests. c, Scatter plots displaying the RPKM of 22G RNAs mapping to transposons in the six individual experiments in input (X-axes) and IP samples (Y-axes). Red line represents the diagonal. d, Venn diagrams displaying the overlaps of WAGO-3 targets (protein-coding) called in hermaphrodites and males with previously determined CSR-1 and MUT-16 targets. e, Stacked bar plot showing number and types of WAGO-3 targets. f, Heat map showing the overlap of WAGO-3 targets (protein-coding) with previously determined sperm-derived 22G RNA targets (protein-coding), which were binned into indicated groups. Values inside the boxes indicate fraction of overlap. Source data are provided.

