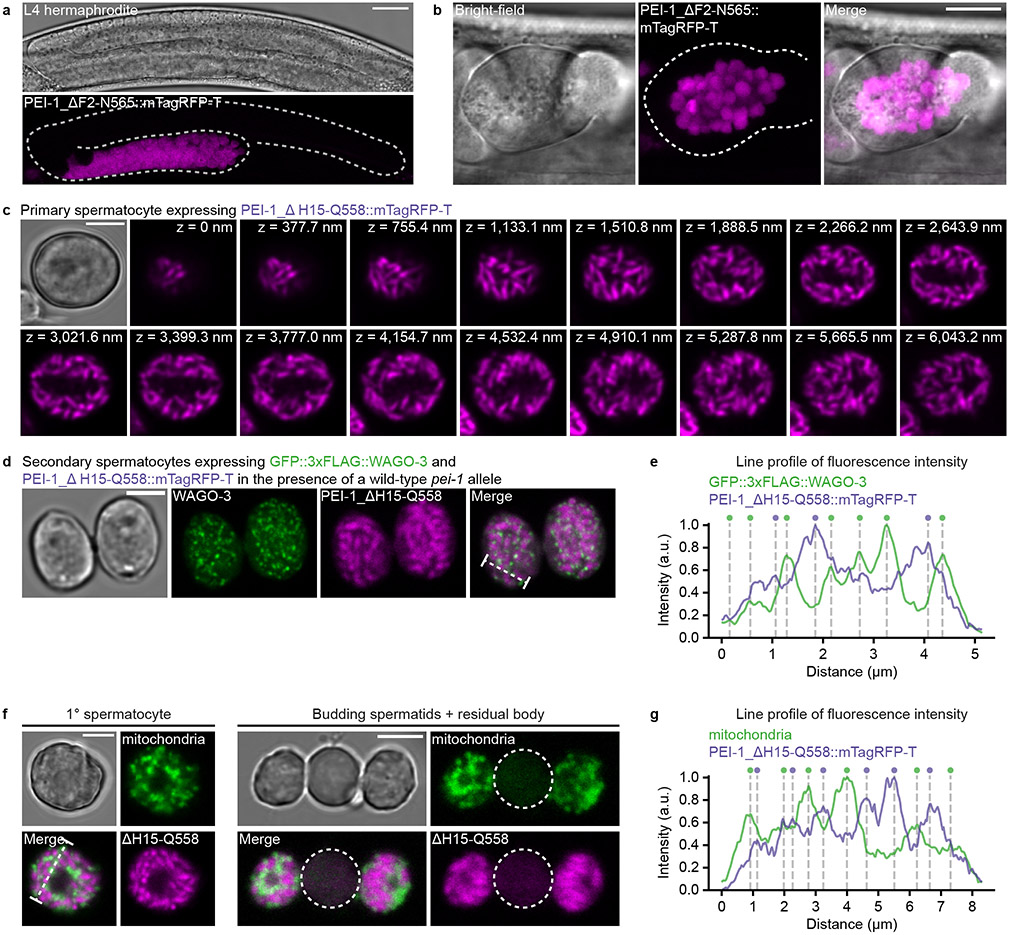
Extended Data Fig. 8. PEI-1 peptides at the N- and C-termini localize to asymmetrically segregated structures of defined shape.
a, Confocal micrograph of an L4 hermaphrodite expressing free mTagRFP-T from the pei-1 locus. The dashed line indicates the outline of the gonad. Scale bar: 20 μm. b, Confocal maximum intensity projection of spermatozoa within the spermatheca of an adult hermaphrodite expressing free mTagRFP-T from the pei-1 locus. The dashed line indicates the outline of the spermatheca. Scale bar: 10 μm. c, Confocal Z-stack of an isolated, male-derived spermatocyte expressing PEI-1_ΔH15-Q558::mTagRFP-T (see Fig. 4a, middle construct). Z-size: 125.9 nm. Scale bar: 4 μm. d, Confocal micrograph of two isolated, male-derived secondary spermatocytes expressing GFP::3xFLAG::WAGO-3 and PEI-1_ΔH15-Q558::mTagRFP-T. The pei-1 locus was heterozygous: pei-1_ΔH15-Q558::mTagRfp-t/pei-1(+). This allowed the formation and visualization of both PEI granules and PEI-1_ΔH15-Q558-specific structures within the same animal. Scale bar: 4 μm. e, Line profiles displaying relative fluorescence intensity for PEI-1_ΔH15-Q558::mTagRFP-T signals versus GFP::3xFLAG::WAGO-3 signals over the indicated, dashed line shown in panel d. Vertical lines and colored circles indicate fluorescence peaks. a.u. – arbitrary unit. f, Confocal micrograph of an isolated, male-derived spermatocyte (left) and budding spermatids (right) showing the subcellular distribution of mitochondria and PEI-1_ΔH15-Q558-specific structures. MitoTracker® Green FM was used to stain mitochondria. Residual bodies are marked by dashed circles. Scale bar: 4 μm. g, Line profiles displaying relative fluorescence intensity for PEI-1_ΔH15-Q558::mTagRFP-T signals versus mitochondria signals over the indicated, dashed line shown in panel f. Vertical lines and colored circles indicate fluorescence peaks. a.u. – arbitrary unit. All images represent two biologically independent experiments. Source data are provided.

