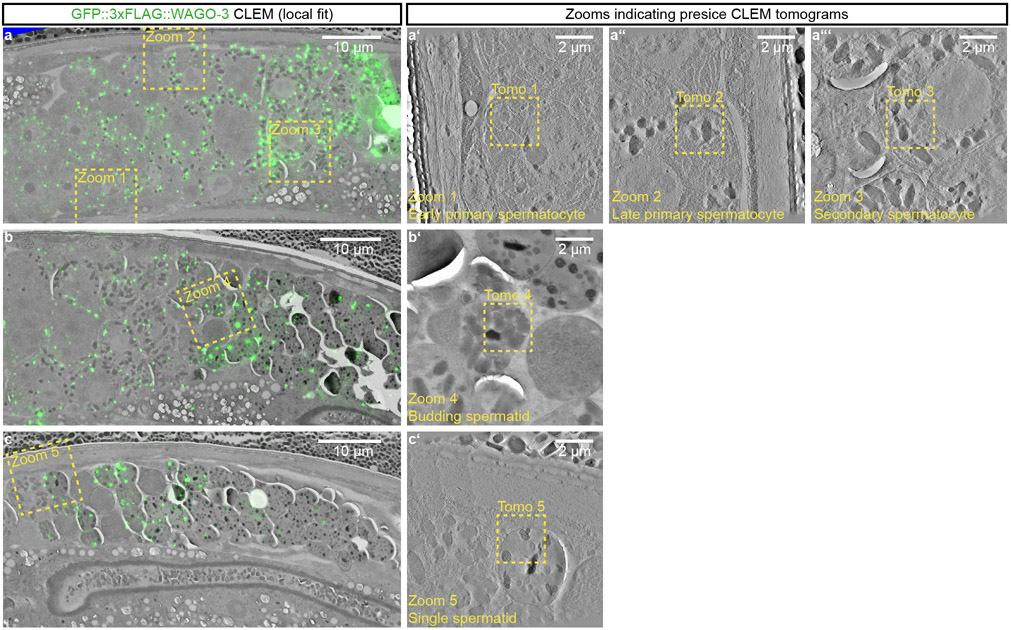
Extended Data Fig. 9. PEI granules are associated with membranous organelles throughout spermatogenesis.
a-c, Overview GFP::3xFLAG::WAGO-3 CLEM montages acquired from three high-pressure frozen adult males expressing GFP::3xFLAG::WAGO-3 and PEI-1::mTagRFP-T. The depicted animals were used to collect the high-resolution CLEM images shown in Fig. 6a-e. In all three panels, germ cell development progresses from left to right. The GFP::3xFLAG::WAGO-3 signal is fitted locally, implying that fluorescence signal was fitted using landmarks (tetraspecks and Hoechst staining) spread over the entire region of interest, spanning a larger field of view. The panels a’-a’”, b’ and c’ depict zoom-ins of the indicated areas in panels a-c. The indicated ‘Tomo’ regions within these zoomed-in panels are shown in greater detail in Fig. 6a-e. Precise CLEM overlays at specific ROIs (Tomos 1 to 5) were done using landmarks more locally and close to each ROI, covering a smaller field of view. The EM grids shown in panels a-c can be navigated using Fiji software and data deposited to Mendeley Data (https://data.mendeley.com/datasets/dgb8d7h2hz/1) , following the instruction listed in Supplementary Information. All images represent two biologically independent experiments.

