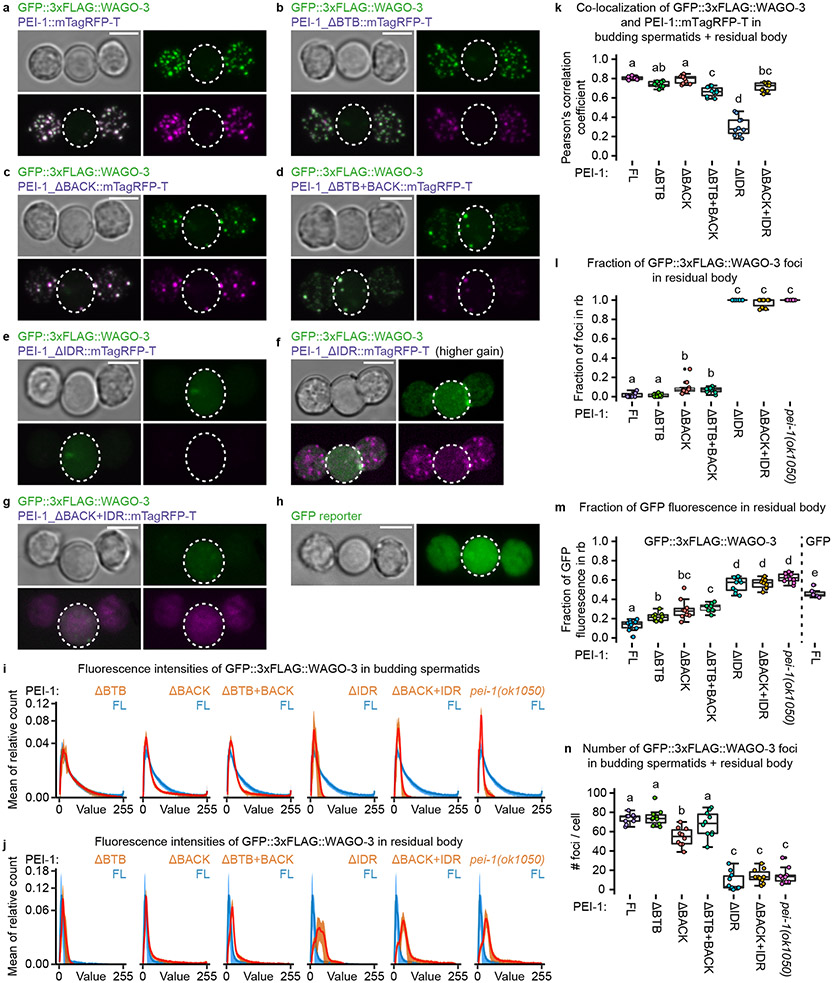
Fig. 4 ∣. The IDR of PEI-1 is required for WAGO-3 segregation into spermatids.
a-h, Confocal maximum intensity projections of isolated, male-derived budding spermatids expressing indicated proteins. In all images: Green – GFP::3xFLAG::WAGO-3 (except h), magenta – PEI-1::mTagRFP-T variants. Residual bodies are marked by a dashed circle. Scale bars: 4 μm. f, Compared to e, this image was acquired with higher gain in order to visualize remaining PEI-1::mTagRFP-T signal within the budding spermatids. h, Free GFP is expressed from the wago-3 locus. i-j, Plots displaying fluorescence intensity (X-axis) versus the mean of relative pixel count (Y-axis) of GFP::3xFLAG::WAGO-3 signal in budding spermatids (i) and residual bodies (j) expressing the indicated PEI-1::mTagRFP-T variants (n = 10 cells pooled from two independent experiments, for each condition). Relative pixel count is the number of pixels with a given intensity within a selected region, divided by the total number of pixels in that region. In each plot, the curve derived from full-length (FL) PEI-1::mTagRFP-T is also depicted in blue. The width of the curves reflects the standard deviation of the mean. k-n, Quantification of co-localization of GFP::3xFLAG::WAGO-3 and PEI-1::mTagRFP-T in budding spermatids + residual body (k), fraction of GFP::3xFLAG::WAGO-3 foci in residual body (l), total GFP::3xFLAG::WAGO-3 signal in residual body (m) and GFP::3xFLAG::WAGO-3 foci number in budding spermatids + residual body (n) of male-derived cells expressing indicated PEI-1::mTagRFP-T variants (FL = full-length, n = 10 cells pooled from two independent experiments, for each condition). Statistically significant differences were determined by one-way ANOVA (p ≤ 0.001) followed by Tukey’s honestly significant difference post hoc test (p ≤ 0.05). Different letters represent significant differences. The exact P values are provided as source data. Boxplot centre and box edges indicate median and 25th or 75th percentiles, respectively, while whiskers indicate the median ± 1.5 x interquartile range. Note that the FL data in k,l,m,n is the same as the wild-type data shown in Fig. 7i, Fig. 7k, Fig. 7l, and Fig. 7j and Extended Data Figure 4c (budding spermatid (c)), respectively. Representative images from two biologically independent experiments are shown in panels a-h. Source data are provided.

