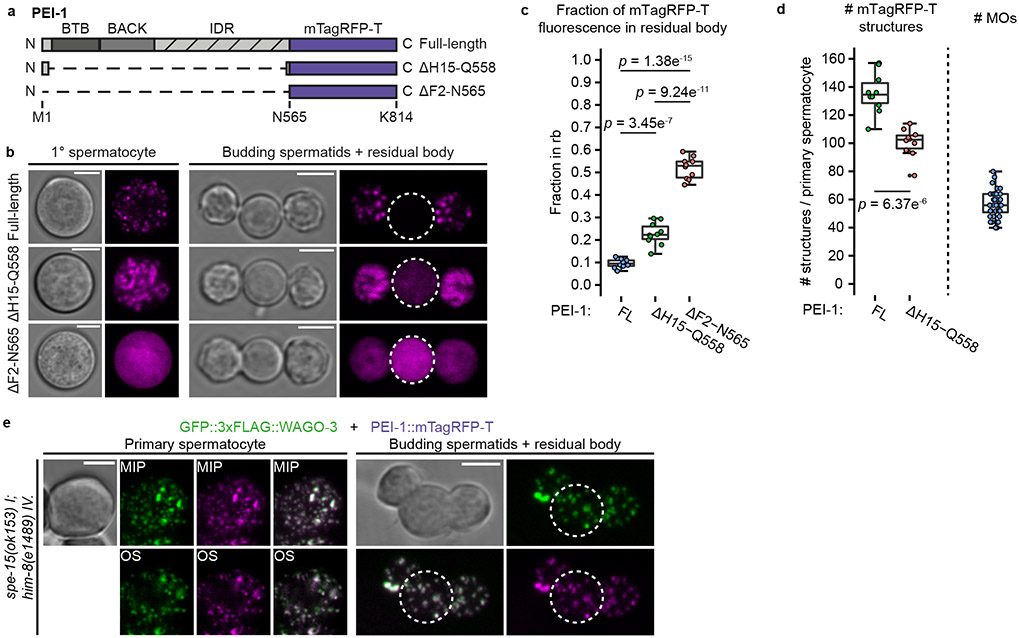
Fig. 5 ∣. PEI granule segregation is dependent on SPE-15.
a, Schematic representation of two mTagRFP-T proteins generated by CRISPR/Cas9 mediated genome editing of the pei-1 locus. The ΔH15-Q558 deletion leaves 14 and 7 amino acids from the PEI-1 N- and C-terminus, respectively. The ΔF2-N565 deletion removes all PEI-1-specific amino acids. IDR – intrinsically disordered region. b, Confocal micrographs of isolated, male-derived spermatocytes (left panel) and budding spermatids (right panel) each expressing one of the proteins shown in a. Dashed circles indicate residual bodies. Images represent two biologically independent experiments. Scale bars: 4 μm. c, Fraction of total mTagRFP-T signal within the residual body of male-derived budding spermatids expressing indicated proteins (FL = full-length, n = 10 cells, which were pooled from multiple experiments, for each condition). Note that the ΔH15–Q558 data is the same as the one displayed in Extended Data Figure 10c (wild-type). d, Quantification of mTagRFP-T structures in isolated, male-derived, primary spermatocytes expressing indicated proteins (FL = full-length, n = 10 cells pooled from two independent experiments, for each condition). To the right: extrapolated number of FB-MOs in primary spermatocytes based on LysoSensor™ Blue DND-192 staining in spermatids (n = 36 cells pooled from two independent experiments). c,d, Statistically significant differences were determined by one-way ANOVA (p ≤ 0.001) followed by Tukey’s honestly significant difference post hoc test (p ≤ 0.05). Boxplot centre and box edges indicate median and 25th or 75th percentiles, respectively, while whiskers indicate the median ± 1.5 x interquartile range. Representative images are shown in b. e, Confocal maximum intensity projections and optical sections of isolated, male-derived spermatocytes and budding spermatids expressing GFP::3xFLAG::WAGO-3 and PEI-1::mTagRFP-T in a spe-15(ok153) mutant background. The strain contained a him-mutation to increase the frequency of males in the cultures. Dashed circles indicate residual bodies. Images represent two biologically independent experiments. MIP - maximum intensity projection. OS – optical section. Scale bars: 4 μm. Source data are provided.

