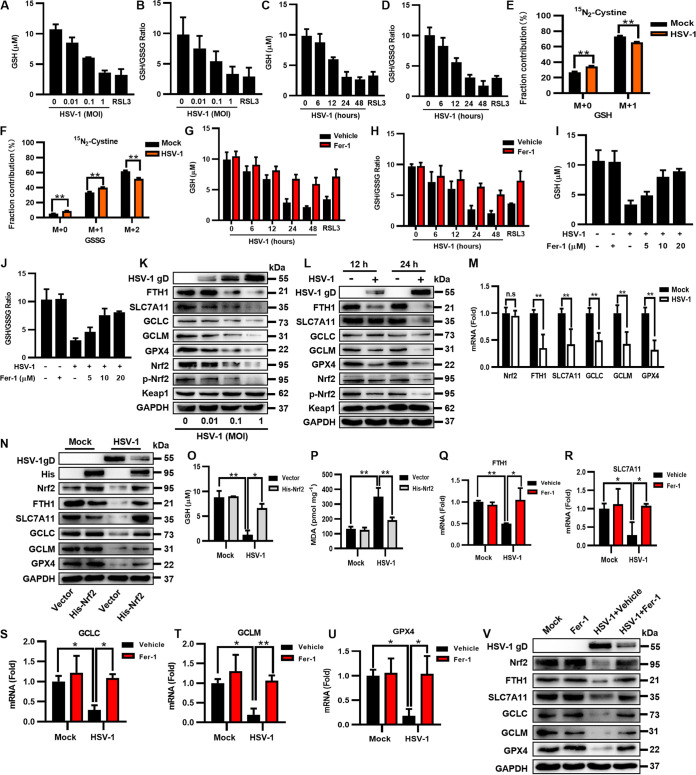
FIG 3.
HSV-1 interrupts the biosynthesis of GSH by downregulating the protein level of Nrf2 in U373 cells. (A to D) U373 cells were infected with HSV-1 at an MOI of 0.01, 0.1, or 1 for 24 h (A and B) or an MOI of 0.1 for 6, 12, 24, or 48 h (C and D). The intracellular GSH level and the GSH/GSSG ratio were measured using a GSSG/GSH quantification kit. (E and F) U373 cells were incubated in cystine-free medium supplemented with 0.26 mM [15N2]cystine and then infected with HSV-1 (MOI = 0.1) for 12 h. The extracted metabolites were analyzed by LC-MS/MS, and the distributions of isotopically labeled GSH and GSSG are presented. Data represent means ± SD from three repeated experiments. **, P < 0.01 (as measured by two-way ANOVA). (G to J) U373 cells were treated with Fer-1 (10 μM) or the vehicle (DMSO), followed by infection with HSV-1 (MOI = 0.1) for 6, 12, 24, or 48 h (G and H), or U373 cells were treated with Fer-1 (5, 10, or 20 μM) or the vehicle (DMSO), followed by infection with HSV-1 (MOI = 0.1) for 24 h (I and J). The intracellular GSH level and the GSH/GSSG ratio were measured using a GSSG/GSH quantification kit. (K and L) U373 cells were infected with HSV-1 at an MOI of 0.01, 0.1, or 1 for 24 h (K) or an MOI of 0.1 for 12 or 24 h (L). Total proteins were subjected to Western blotting with antibodies to HSV-1 gD, FTH1, SLC7A11, GCLC, GCLM, GPX4, Nrf2, p-Nrf2, Keap1, and GAPDH. (M) The expression levels of the indicated genes in U373 cells infected with HSV-1 (MOI = 0.1) were determined by qRT-PCR at 24 hpi. The relative mRNA level of each gene in uninfected cells was defined as 1-fold. Data represent means ± SD from three repeated experiments. **, P < 0.01; n.s, no significance (as measured by an unpaired t test). (N to P) U373 cells were transfected with a plasmid encoding His-Nrf2 or an empty vector and then infected with HSV-1 (MOI = 0.1). (N) At 24 hpi, total proteins were subjected to Western blotting with the indicated antibodies. (O) The intracellular GSH level was measured using a GSSG/GSH quantification kit. (P) The intracellular MDA concentration was determined by an MDA assay. Data represent means ± SD from three repeated experiments. *, P < 0.05; **, P < 0.01 (as measured by two-way ANOVA). (Q to V) U373 cells were treated with Fer-1 (10 μM) or the vehicle (DMSO), followed by infection with HSV-1 (MOI = 0.1) for 24 h. (Q to U) Total RNAs were subjected to qRT-PCR to determine the expression levels of the indicated genes, and the relative mRNA level of each indicated gene in uninfected cells treated with the vehicle was defined as 1-fold. Data represent means ± SD from three repeated experiments. *, P < 0.05; **, P < 0.01 (as measured by two-way ANOVA). (V) Total proteins were subjected to Western blotting with the indicated antibodies.

