FIG 1.
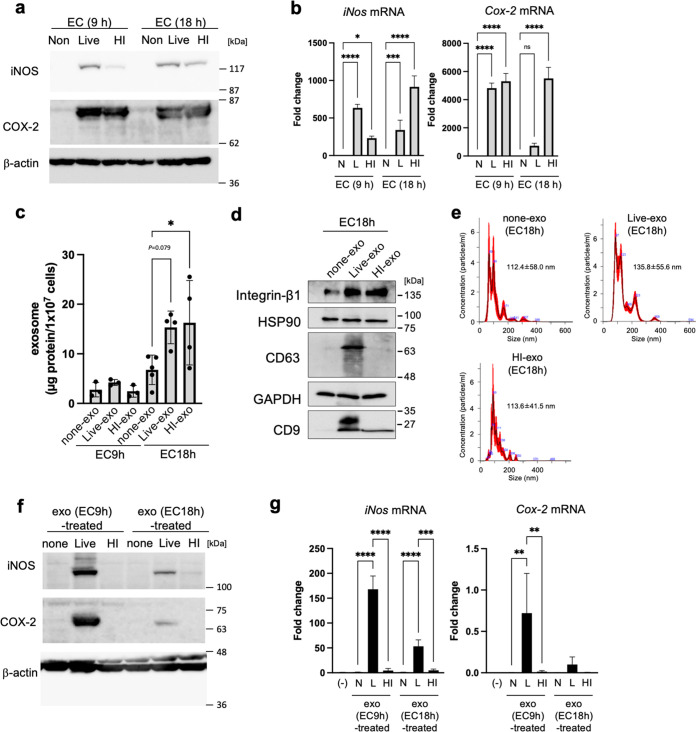
Increase in the proinflammatory mediators by exosomes from macrophages that were infected with live E. coli. After mouse RAW264.7 macrophages (Mφ) were infected for 9 or 18 h with live (L) or heat-inactivated (HI) E. coli K-12 strain (EC) at a multiplicity of infection (MOI) of 5, the exosomes (none-exo, live-exo, and HI-exo) were prepared from their culture media of cells. (a) The protein expression of inducible nitric oxide synthase (iNOS) and cyclooxygenase-2 (COX-2) in whole-cell lysates was measured by Western blotting. β-Actin was used as loading control. (b) The mRNA levels of iNos and Cox-2 in bacteria-infected cells were analyzed by quantitative real-time PCR and normalized to 18S rRNA. Values are expressed as the mean ± SD (n = 4) of at least three independent biological replicates. (c to e) Exosomes (live-exo or HI-exo) from donor Mφ, which were infected with live or HI E. coli for 9 or 18 h, were isolated by ultracentrifugation. Exosomes (none-exo) from uninfected Mφ were collected as control. (c) The amounts of exosomes were measured by protein concentration. (d) The expression of exosome markers, including integrin β1, heat shock protein 90 (HSP90), CD63, glyceraldehyde-3-phosphate dehydrogenase (GAPDH), and CD9 in exosomes from donor Mφ, which were infected with live or HI E. coli for 18 h, were detected by Western blotting. (e) Particle size of exosomes derived from donor Mφ, which were infected with live or HI E. coli for 18 h, was analyzed by NanoSight. Values are expressed as the mean ± SD. (f, g) RAW 264.7 cells (recipient cells; 5 × 10⁵ cells) were incubated with exosomes from donor cells (1 × 10⁶ cells). (f) After incubation for 24 h, the expression of iNOS and COX-2 in whole-cell lysates was measured by Western blotting. β-Actin was used as loading control. (g) After incubation with each exosome for 24 h, the mRNA levels of iNos and Cox-2 were analyzed by quantitative real-time PCR and normalized to 18S rRNA. Values are expressed as the mean ± SD (n = 3 to 4) of at least three independent biological replicates. One-way ANOVA and Tukey’s test were used for statistical analysis; *, P < 0.05; **, P < 0.01; ***P < 0.005; ****, P < 0.001; ns, not significant.

