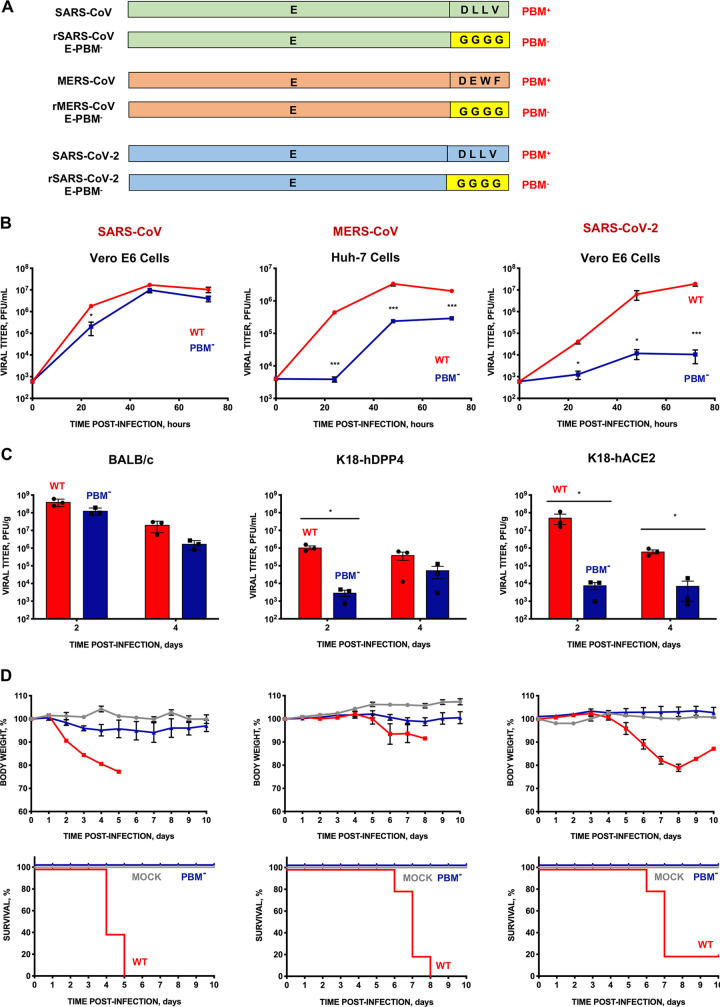
FIG 1.
Growth and virulence of SARS-CoV, MERS-CoV, and SARS-CoV-2 mutants lacking E protein PBM. (A) Diagram mutant pairs, with (PBM+) and without the PBM (PBM−), were generated for each of the three viruses. In the rSARS-CoV-E-PBM−, rMERS-CoV-E-PBM−, and rSARS-CoV-2-E-PBM− mutants, the PBM of E protein was replaced by four glycines. (B) Subconfluent Vero E6 or Huh-7 cells were infected with an MOI of 0.001 with each of the three viruses. Wild- type (WT) viruses are shown with red lines and symbols. Mutants without E protein PBM (PBM−), with blue lines and symbols. Supernatants were collected at 24, 48, and 72 hpi and titrated by the lysis plaque formation method. (C) Groups of six 16-week-old BALB/c, K18-hDPP4, or K18-hACE2 mice were intranasally inoculated with 10,000 PFU of the WT viruses (red columns) or each of the mutants lacking E protein PBM (blue columns). Three mice from each group were euthanized at 2 and 4 dpi to analyze virus production in lung. Vertical bars represent the standard error of the mean. Statistically significant data are represented according to the P value obtained in Student’s t test analysis: *, P < 0.05; ***, P < 0.001. (D) Groups of five 16-week-old BALB/c, K18-hDPP4, or K18-hACE2 mice were mock-infected (gray lines) or intranasally inoculated with 10,000 PFU with each of the parental (WT) virus (red lines), or with their corresponding mutants without PBM of E protein (PBM−) (blue lines). Weight loss (top) and survival (bottom) of mice were monitored for 10 days postinfection. Vertical bars represent the standard error of the mouse weight mean.

