FIG 6.
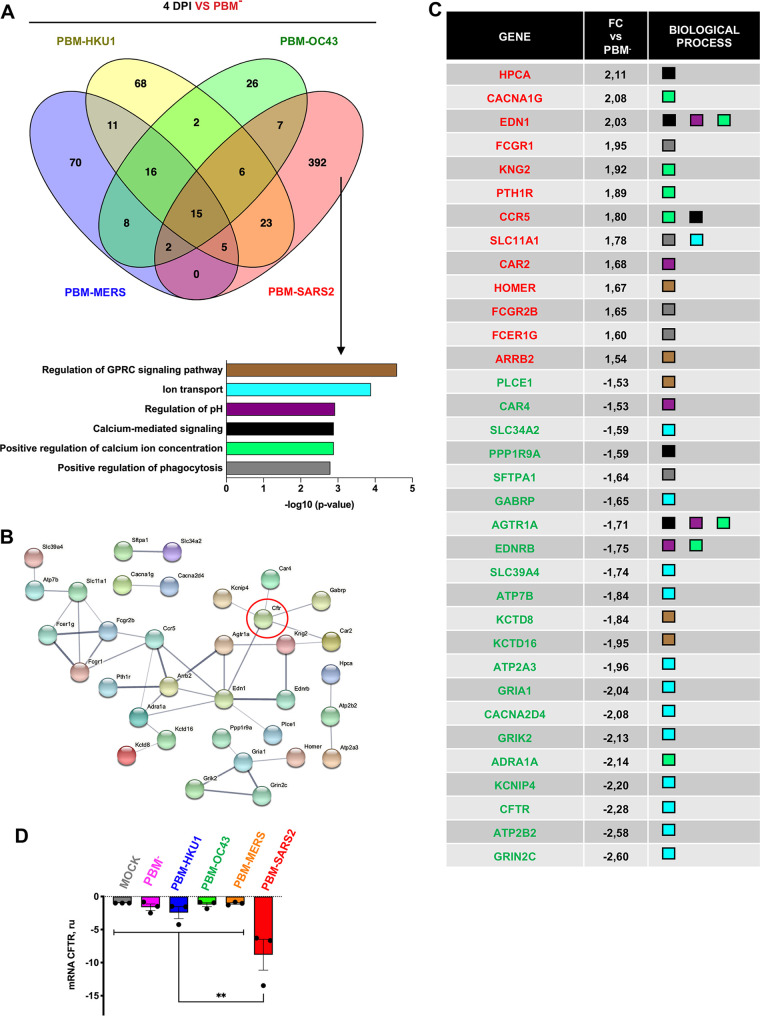
Biological activity groups of genes differentially expressed exclusively due to the presence of E protein PBM from either SARS-CoV and SARS-CoV-2. (A) Clustering of 392 genes that are differentially expressed in the lungs of mice infected with the native virus compared to rSARS-CoVs without a PBM or with a PBM from another hCoV. The clustering of these genes is based on the biological process terms defined in Gene Ontology. The six more relevant biological processes are represented. (B) Network of interactions between genes that belong to the most relevant biological processes according to the STRING database. The thickness of the lines indicates the robustness of the data supporting each interaction and all those interactions with a score >0.4 were considered statistically significant. (C) Table with information on the rate of change (FC) and the biological processes to which the genes of the most relevant interaction networks belong. The names of the genes are shown in red or in green depending on whether correspond to those that increased or decreased their expression. (D) RT-qPCR of CFTR mRNA expression in lungs from mice infected with SARS-CoV E protein PBM mutants. RNA from lungs of mock-infected mice (gray column)or infected with PBM-SARS2 (red column) or with the E protein PBM mutants PBM-MERS (orange column), PBM-HKU1 (blue column), PBM-OC43 (green column), and PBM− (pink column) were quantified by RT-qPCR at 4 dpi. Mean values and their standard deviations are presented. Statistically significant data are indicated according to the P value obtained in Student’s t analysis: **, P < 0.01.

