FIG 8.
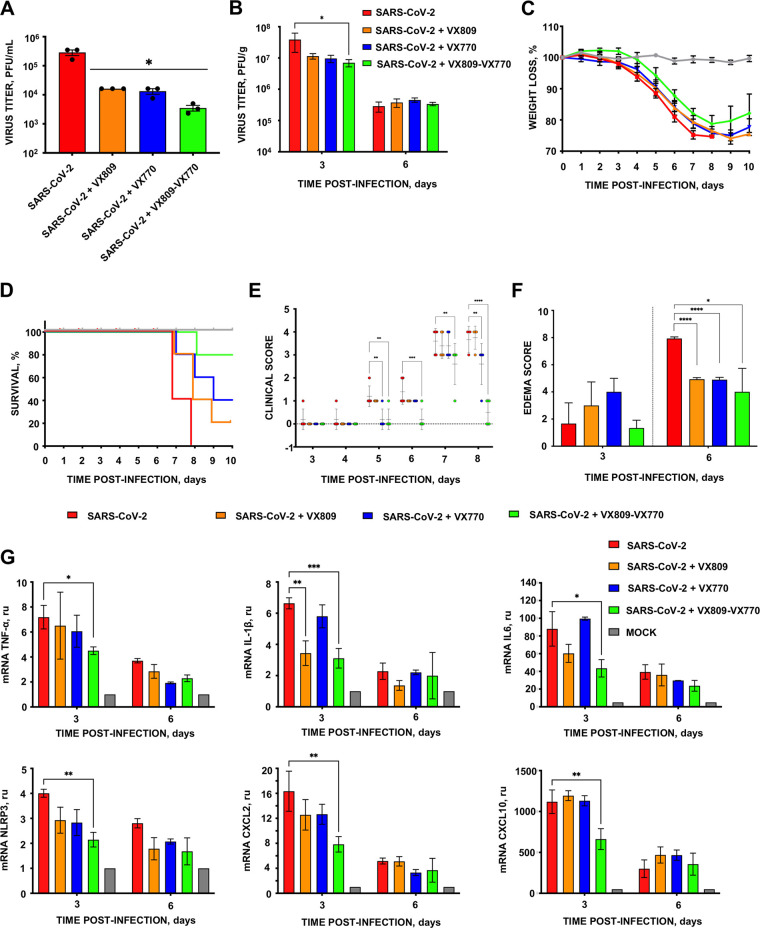
Protection of mice infected with SARS-CoV-2 by the modulation of CFTR expression. (A) Subconfluent Calu-3 2B4 cells were infected (MOI of 0.1) with SARS-CoV-2 wt virus. Infected cells were nontreated (red lines) or incubated with lumacaftor (VX809; 50 μM) (orange column), ivacaftor (VX770; 5 μM) (blue column) or both (green column). Culture supernatants were collected at 48 hpi and extracellular virus was titrated by the lysis plaque formation method. (B) Groups of five 20-week-old K18-hACE2 mice were intranasally inoculated with 10,000 PFU and daily intraperitoneally inoculated until 8 dpi with lumacaftor (12 mg/kg; orange column), ivacaftor (6 mg/kg; blue column), or both (green column). Three mice from each group were euthanized at 3 and 6 dpi to analyze virus production in lung. Vertical bars represent the standard error of the mean titers obtained by repeating the experiment three times. Statistically significant data are represented according to the P value obtained in Student’s t test: *, P < 0.05. Weight loss (C) and survival (D) of mice were monitored for 10 days postinfection. Vertical bars represent the standard error of the mouse mean weight. (E) Clinical score of mice infected with SARS-CoV-2 in the absence (red circle) or presence of VX809 (orange circle), VX770 (blue circle), or both CFTR modulators (green circle). Five mice per group were monitored daily for 10 dpi and their clinical signs of disease were classified in five grades of severity. Vertical bars represent the standard deviation of the mean derived from clinical scores obtained from five mice. Statistically significant data are represented according to the P value obtained in Student’s t analysis: **, P < 0.01; ***, P < 0.001; ****, P < 0.0001. (F) Edema scores were determined in lung samples as indicated in Materials and Methods (n = 3/group). The vertical bars represent the mean and the standard deviation of the data obtained in the lung of each of the three mice used for each experimental setting. Unpaired t test: *, P < 0.05; ****, P < 0.0001. (G) mRNA quantification by RT-qPCR of inflammation mediators at 3 and 6 dpi in the lungs of infected mice treated with lumacaftor and ivacaftor. mRNA levels were compared to those in mock-infected mice, using the 2−ΔΔCT method and the 18S rRNA as the normalization endogenous control. Error bars indicate the standard error of the mean. Statistical significance was calculated by two-tailed Student’s t test. *, P < 0.05; **, P < 0.01; ***,P < 0.001.

