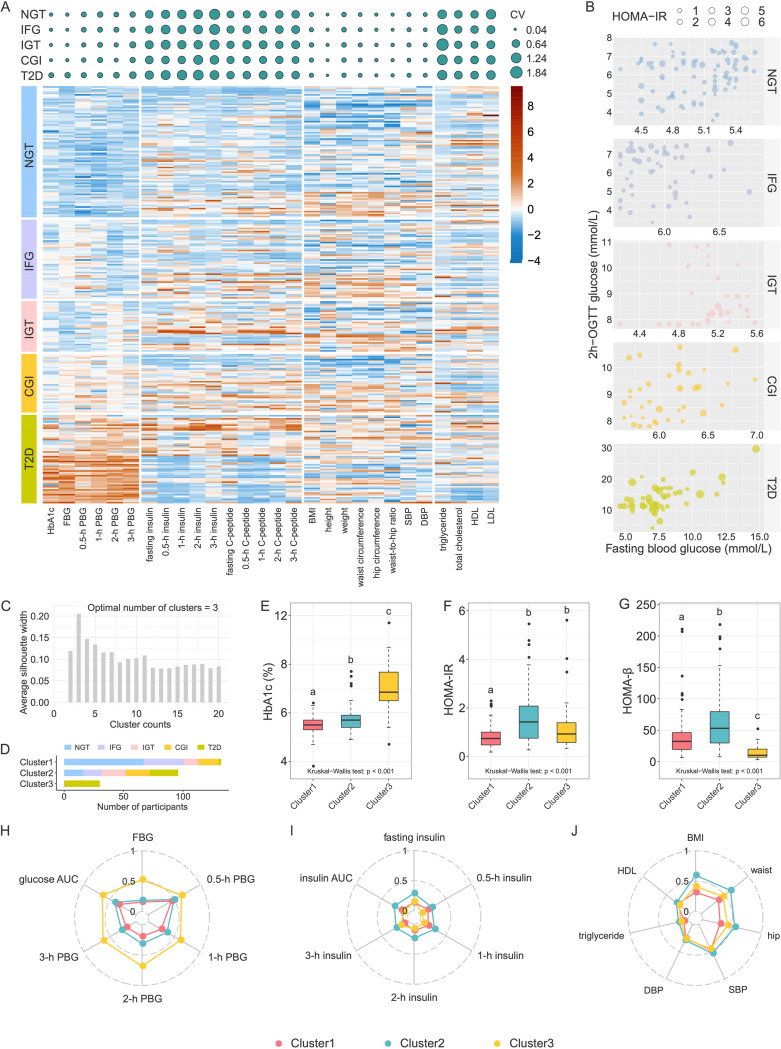
FIG 1.
Metabolic characteristics of the unsupervised-stratification-based clusters. (A, top panel) Coefficients of variation (CV) of clinical variables in each ADA group. The size of the circle indicates the CV value. (Bottom panel) Heatmap of clinical variables. The values were scale transformed by column. (B) Variations of HOMA-IR among members within the same blood glucose range. (C) Silhouette coefficient corresponding to the number of clusters from 2 to 20. (D) The number of participants in each cluster, with colors indicating glycemic categories (NGT, normal glucose tolerance; IFG, impaired fasting glycemia; IGT, impaired glucose tolerance; CGI, combined impaired fasting glycemia and impaired glucose tolerance; T2D, type 2 diabetes). (E to G) Comparisons of HbA1c (E), HOMA-IR (F), and HOMA-β (G) among clusters. Boxes show the medians and the interquartile ranges (IQRs), the whiskers denote the lowest and highest values that were within 1.5 times the IQR from the first and third quartiles, and the outliers are shown as individual points. The Kruskal-Wallis test P value is shown at the bottom of each plot. A Wilcoxon rank sum test was used for comparisons between two clusters (adjusted by FDR). Clusters with common characters were not significantly different (FDR > 0.05). (H to J) Radar charts show the median values of clinical parameters related to blood glucose levels (H), blood insulin levels (I), and lipometabolism (J). Each spoke in the chart represents one cluster.

