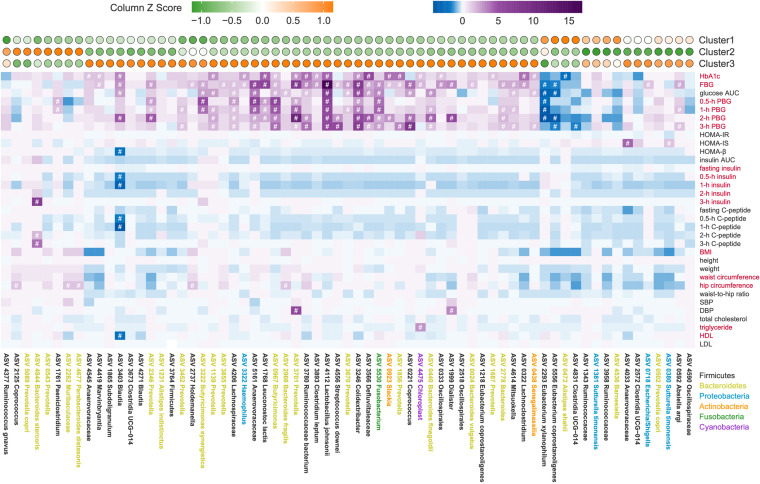
FIG 3.
Cluster-specific microbiome features identified based on unsupervised-stratification-based clusters. (Top panel) The colors of circles indicate the scale-transformed mean abundance of the 67 ASVs in each cluster. These ASVs were clustered with a Spearman correlation coefficient and ward linkage based on their scale-transformed abundance values. (Middle panel) Association between ASVs and clinical variables. The colors denote the correlation coefficients. P values were adjusted by Benjamini-Hochberg procedure. #, Adjusted P < 0.25 was considered to be statistically significant based on the instruction of MaAslin2. Age and gender were considered to be covariates. Red text on the right indicates the variables used for classification. (Bottom panel) Taxonomy of ASVs. Colors represent the phyla.

