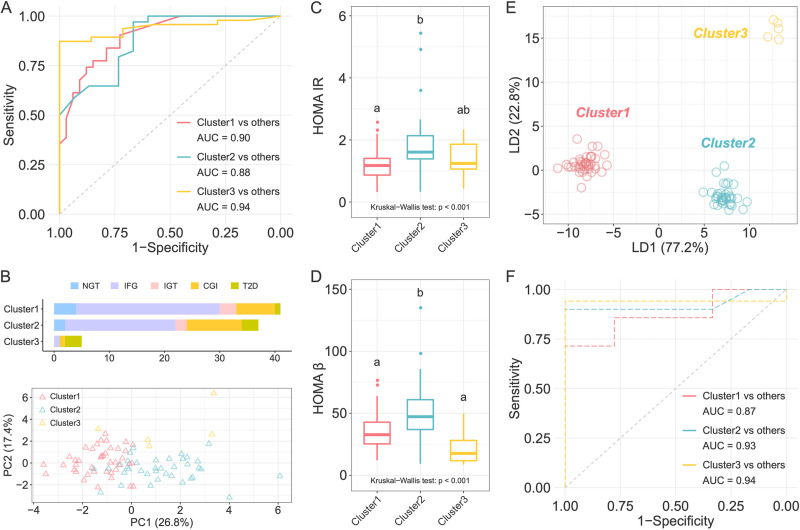
FIG 4.
Classification based on cluster-specific microbiome features in the testing cohort. (A) Receiver-operating characteristic (ROC) curves for classification of individuals in one cluster from the other two clusters in the discovery cohort. The random forest classifier was constructed based on leave-one-out cross-validation using the 67 cluster-specific ASVs. (B) The number of participants in each cluster in the testing cohort, with colors indicating glycemic categories according to ADA criteria, and PCA plot showing the different clinical phenotype of three clusters. (C and D) Comparisons of HOMA-IR (C) and HOMA-β (D) among clusters. The Kruskal-Wallis test P value is shown at the bottom of each plot. Boxes, whiskers, and outliers denote values as described for Fig. 1E. A Wilcoxon rank sum test was used for comparisons between two clusters (adjusted by FDR). Clusters with common characters were not significantly different (FDR > 0.05). (E) LDA score plot of the three clusters based on the abundance of ASVs. (F) ROC curves for classification of individuals in one cluster from the other two clusters in the testing cohort using the 67 cluster-specific microbial features identified in the discovery cohort.

