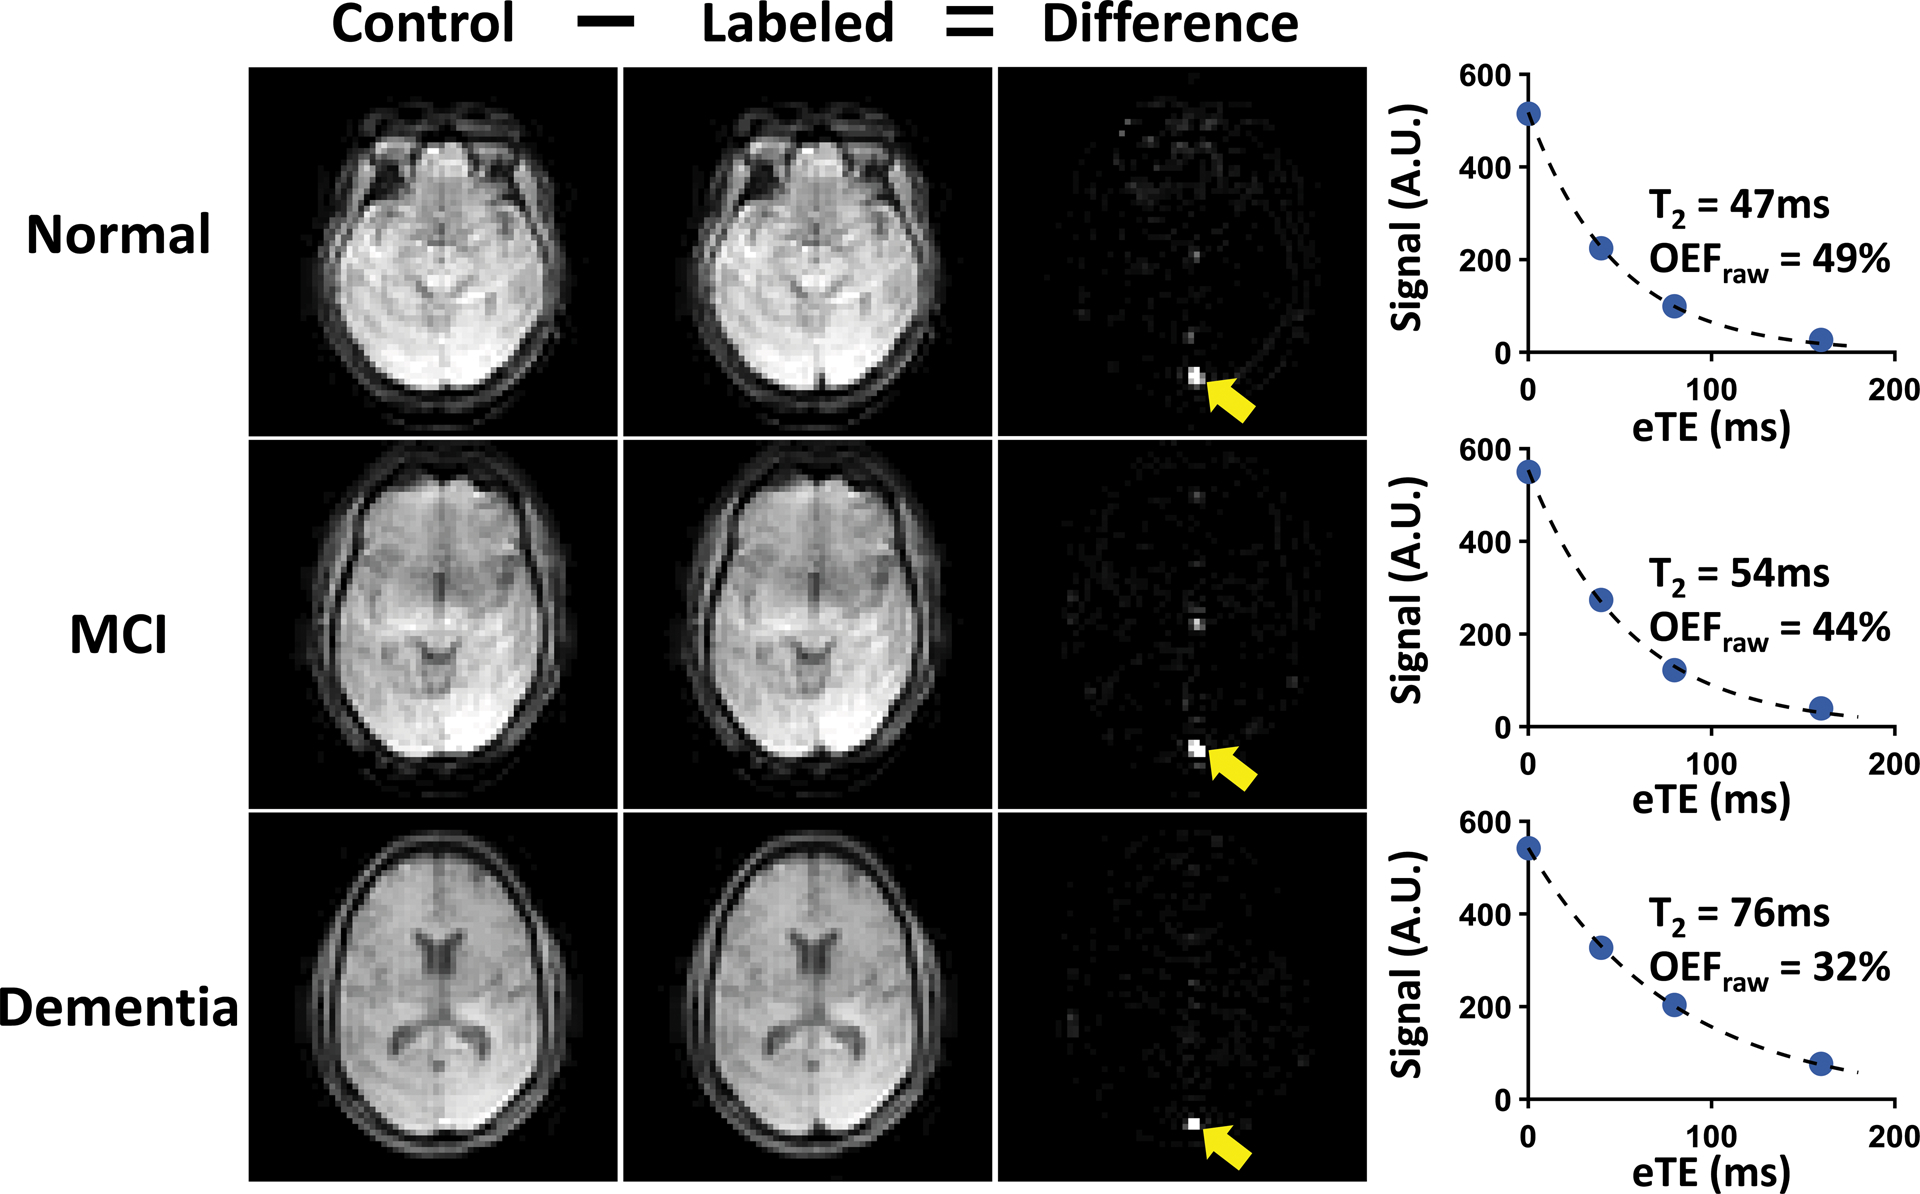
Figure 1:

Representative TRUST OEF data. Representative data of normal (top row), MCI (second row) and dementia (bottom row) subjects are shown. Subtraction between control (first column) and labeled (second column) images yields strong venous blood signal in the superior sagittal sinus (yellow arrows) in the difference images (third column). The scatter plots on the far right show venous signal as a function of effective echo times (eTEs). Fitted venous blood T2 and the corresponding OEF values (before correction) are also shown.
