
Figure 3:
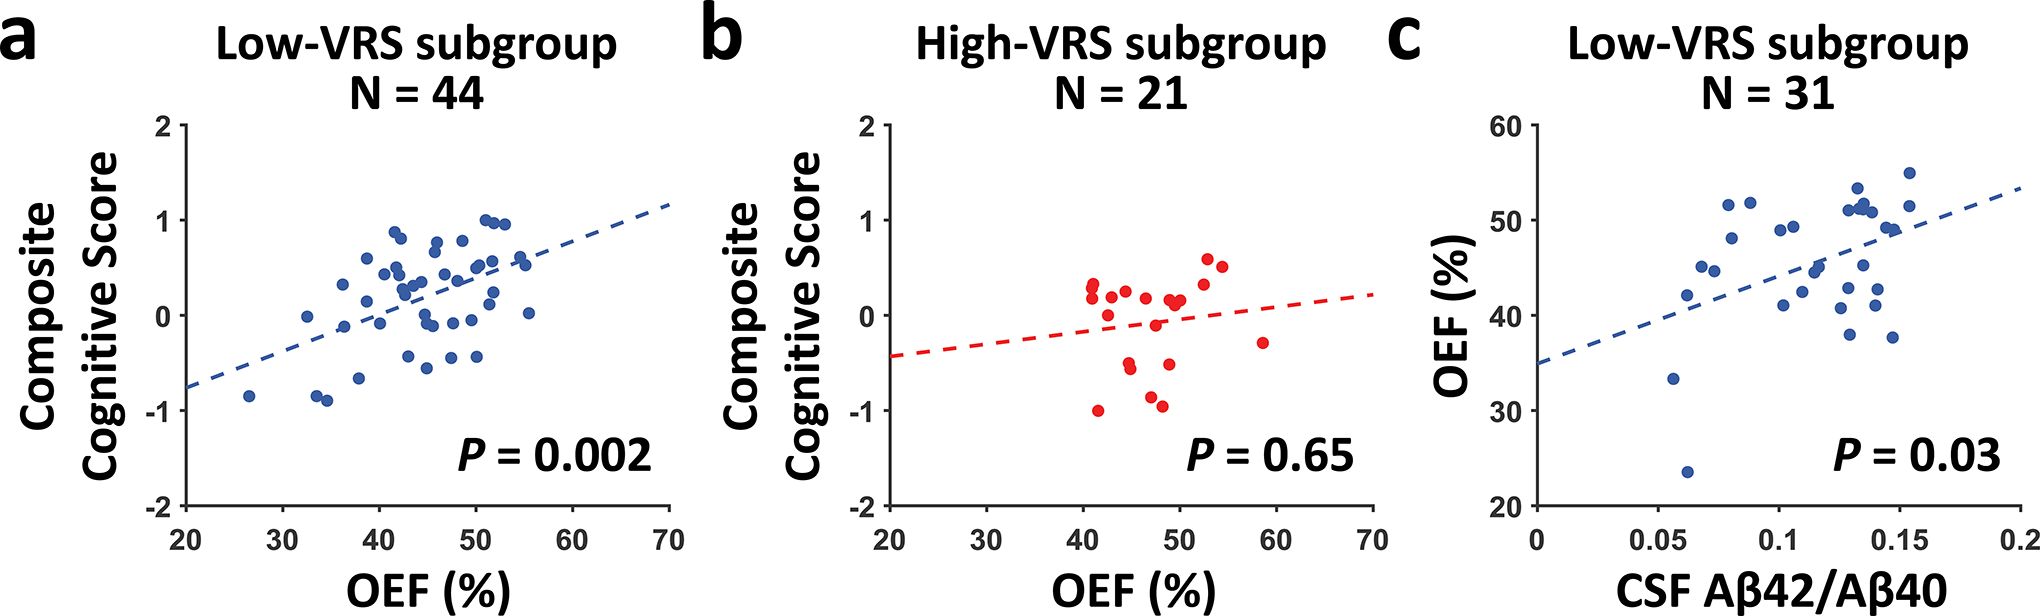
Relationship of OEF with composite cognitive score and CSF Aβ42/Aβ40 ratio. (a) Scatter plots between composite cognitive score and OEF in the low-VRS subgroup. (b) Scatter plots between composite cognitive score and OEF in the high-VRS subgroup. (a) and (b) have been adjusted for age, gender, and education. (c) Scatter plot between OEF and CSF Aβ42/Aβ40 ratio in the low-VRS subgroup, adjusted for age and sex. Dashed lines indicate the fitted linear regression lines.