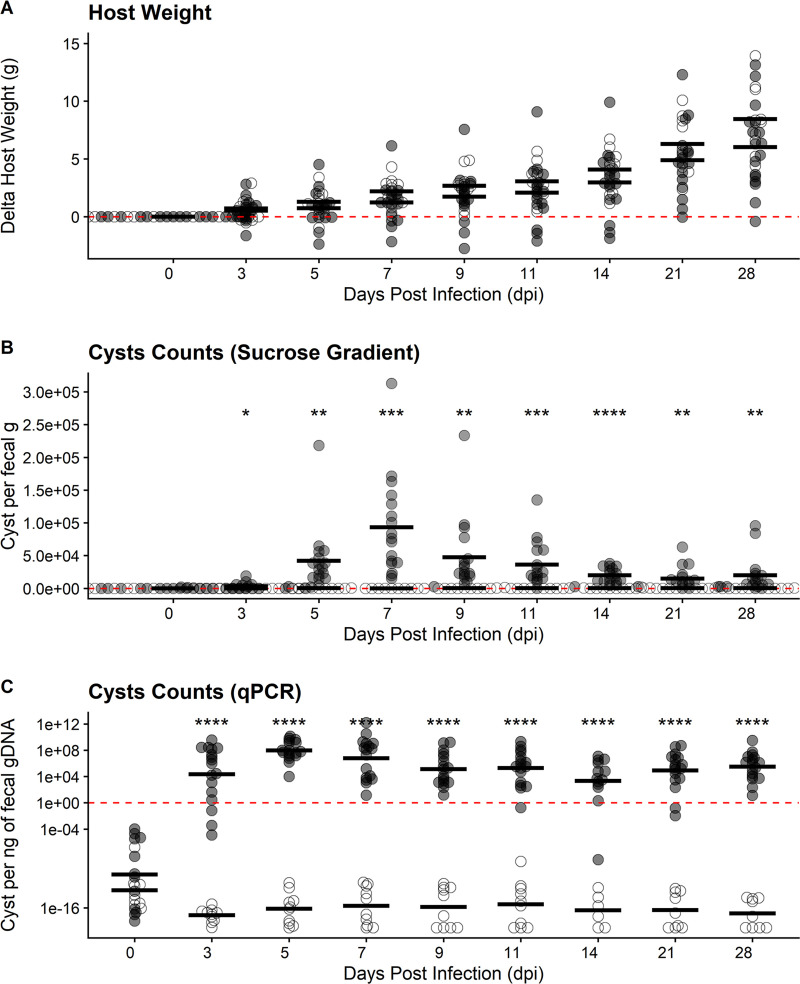
FIG 2.
Swiss Webster mice are susceptible to Entamoeba muris oral challenge. (A) Host weight was monitored through the course of infection. (B) Quantification of cysts isolated by sucrose gradient from Swiss Webster fecal samples (normalized by fecal mass). Peak of infection was determined to be 7 dpi. (C) Quantification of cysts in fecal samples via qPCR isolated from Swiss Webster’s fecal samples (normalized by gDNA per qPCR). Each dot represents a single mouse (n = 27 mice, 17 infected and 10 uninfected controls). Open circles represent uninfected mice while gray circles represent infected mice. Significance was determined using a two-tailed t test between the uninfected versus infected average per DPI. Data combines four independent biological replicates (see Fig. S3 for individual biological replicate [n = 4] plotting).

