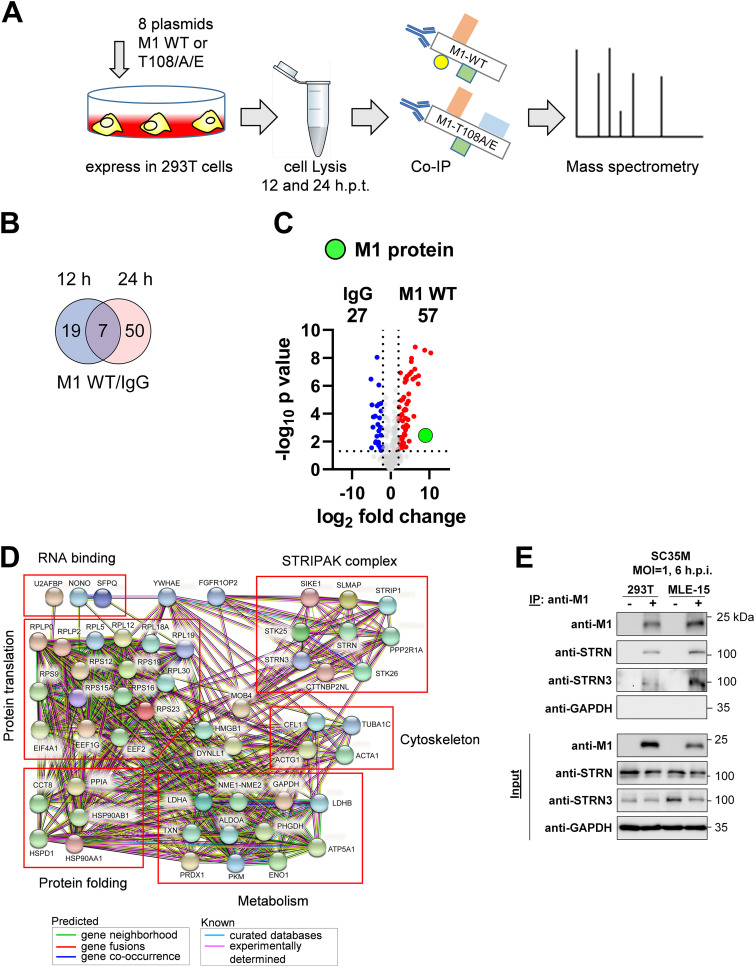
FIG 4.
Identification of the M1 interactome. (A) Schematic display of the experimental setup used to identify proteins binding to M1 WT or its T108 phospho mutants. 293T cells expressing 8 plasmids encoding SC35M together with M1 WT, M1 T108A, or M1 T108E were lysed. An aliquot of the lysates was used for immunoblotting to ensure proper and comparable expression of M1, while the remaining material was subjected to co-IP using anti-M1 antibodies or a nonspecific control rabbit IgG. The immunoprecipitates were subsequently subjected to mass spectrometric analysis; data were acquired from three biological replicates. (B) Proteins interacting with M1 at 12 or 24 h.p.t. were identified by comparison to the IgG controls, and specific interaction with M1 was defined to occur with an LFC of ≥1 in a statistically significant manner (P ≤ 0.05). These analyses yielded M1 interactors for both time points; a comparison is shown in the Venn diagram. (C) The M1 interactomes of the cells expressing M1 WT for 24 h.p.t. were subjected to pairwise comparisons with the IgG control by using Volcano plots. Specific M1 interactors (LFC of ≥1; P ≤ 0.05) are shown in red, and M1 is highlighted in green. (D) The STRING database (version 11.5) was used to reveal known and predicted interactions between the M1 interactors; the proteins were grouped according to their biological functions, as shown. (E) 293T cells or MLE-15 cells infected with SC35M (MOI = 1) were harvested at 6 hpi, and cell lysates were prepared. One fraction of the lysate was used as an input control, while the remaining material was used for co-IP experiments using anti-M1 antibodies, as shown. The indicated proteins were detected by Western blotting analysis with specific antibodies.

