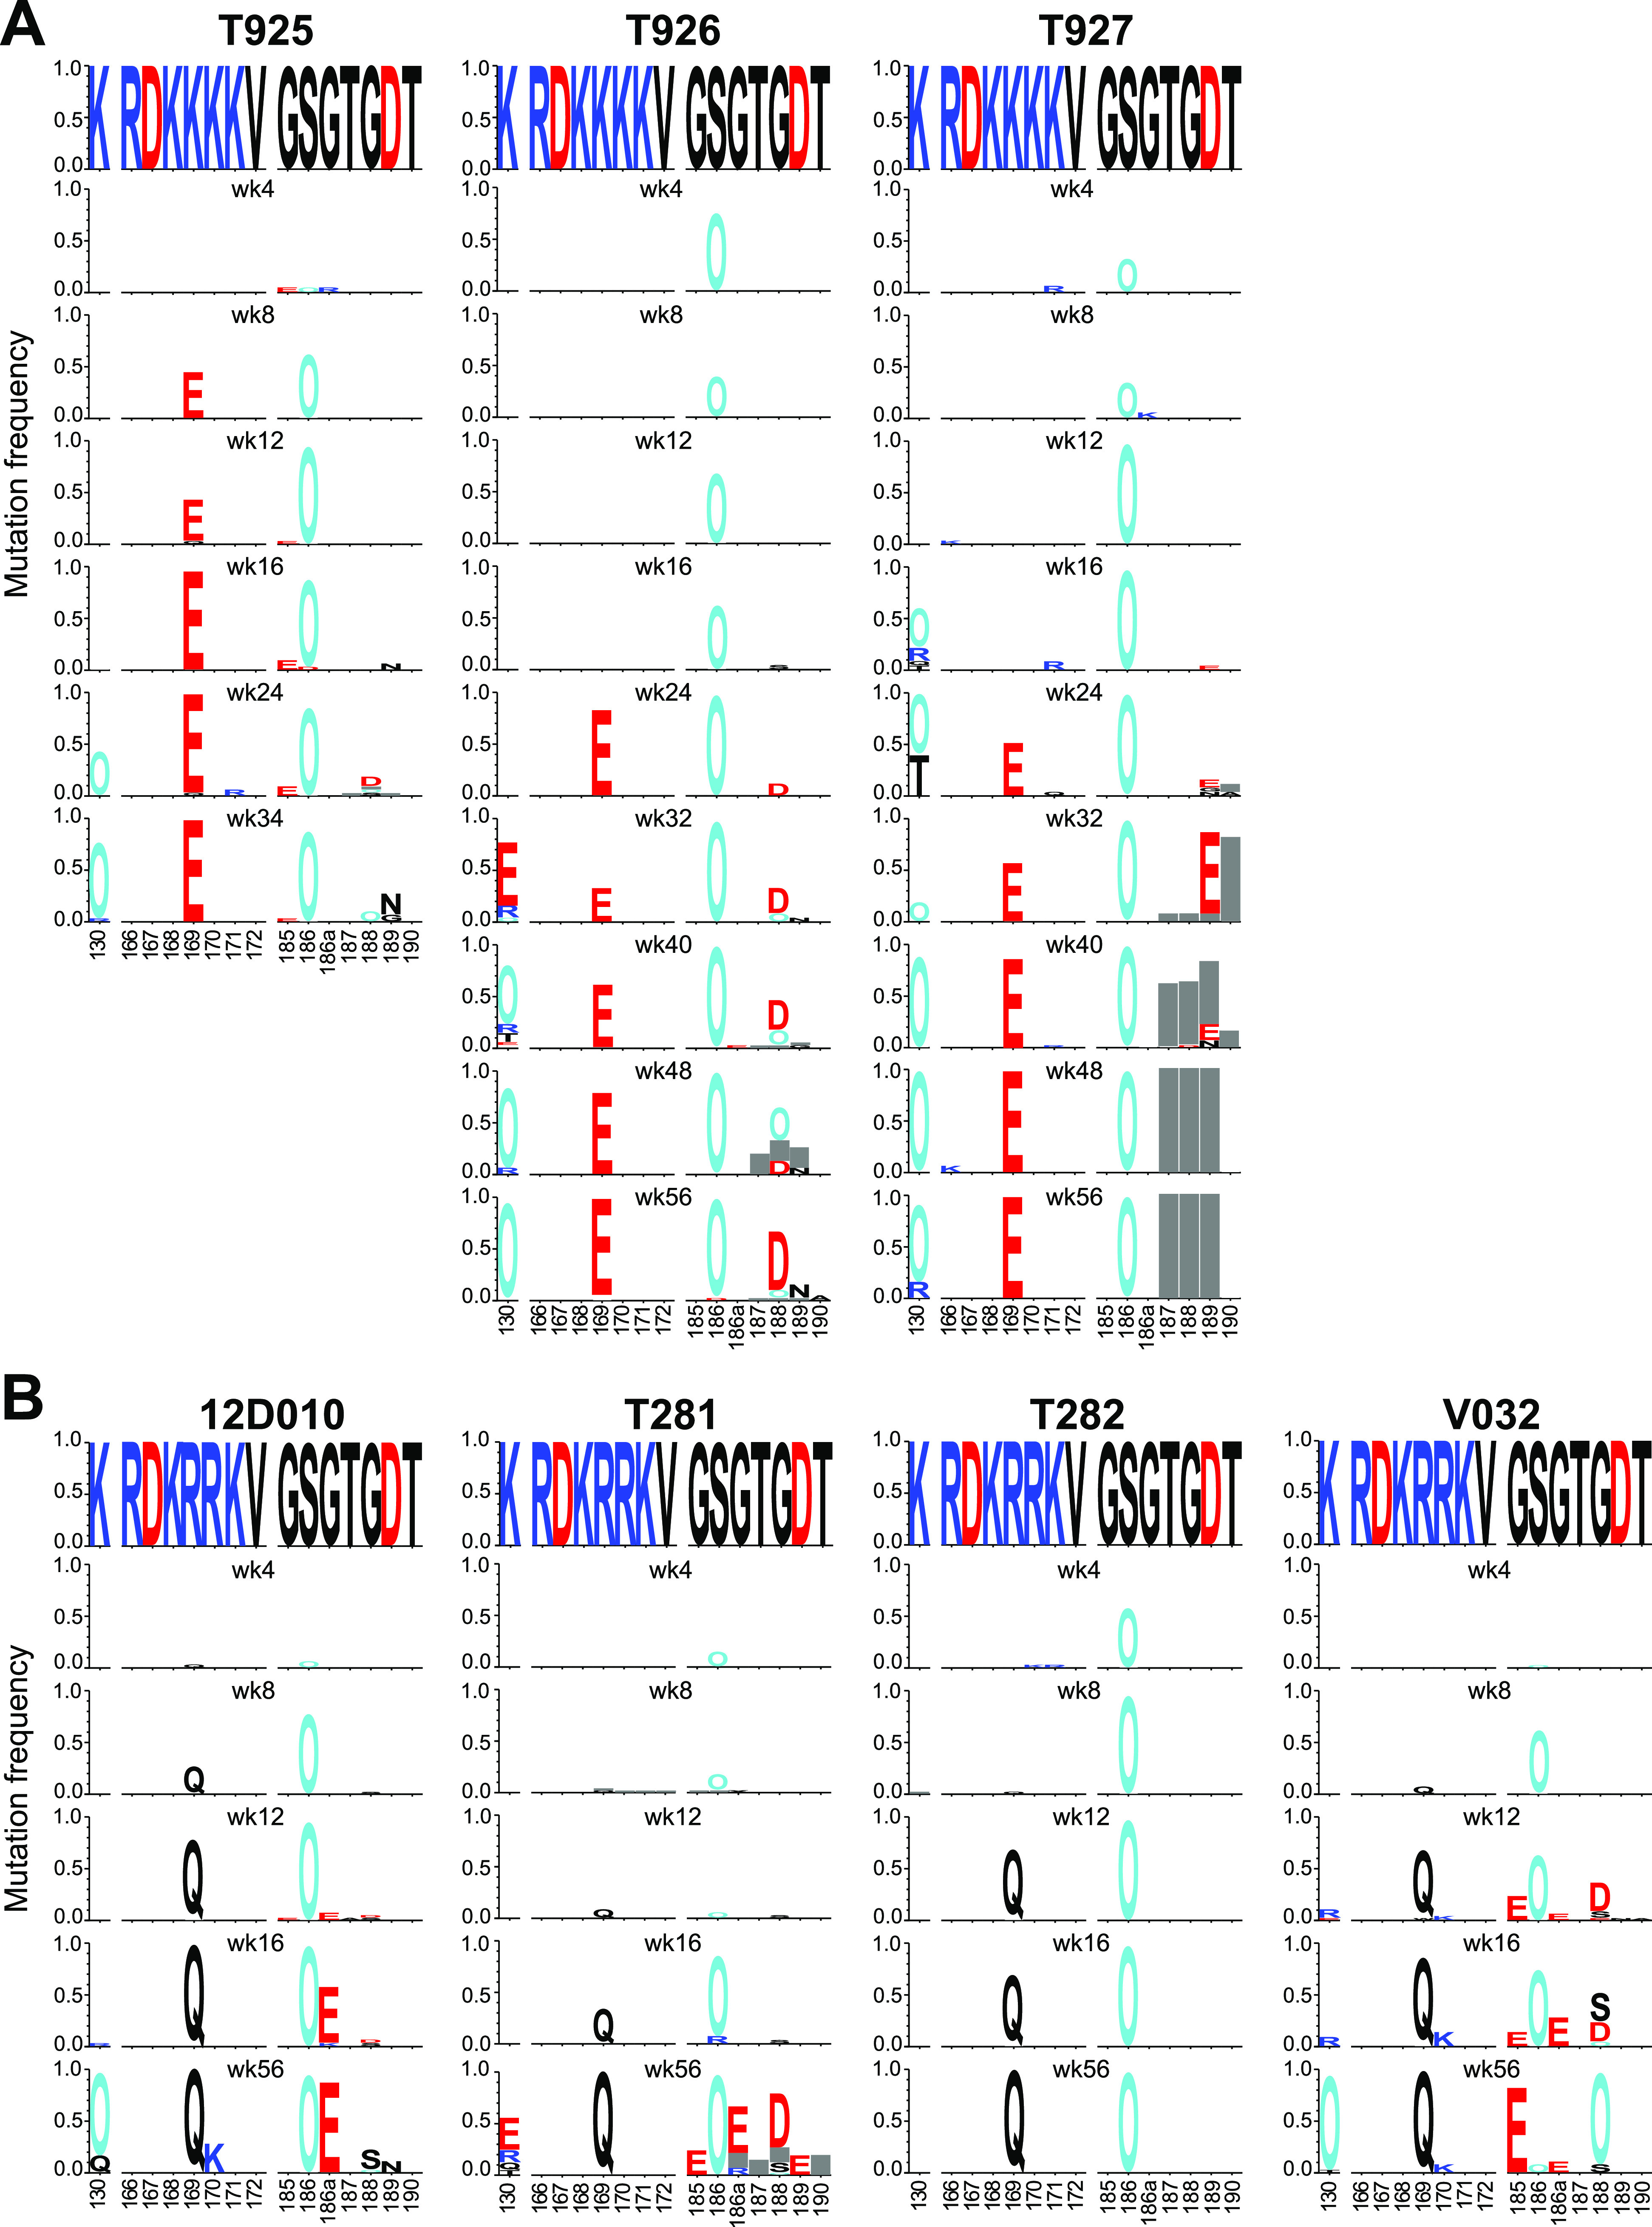
FIG 4.

SCIV infection elicits strong V2-apex directed immune selection. (A, B) Longitudinal Env evolution at the V2-apex is shown over time for the N-linked glycosylation site at position 130, strand C (amino acids 166 to 172), and the hypervariable part of the V2 loop (amino acids 185 to 190) for all SCIV.CAM13K (A) and SCIV.CAM13RRK (B) infected RMs (see Fig. S3 for a similar analysis of the entire Env). Sequences are shown as logo plots, where the height of each amino acid is proportional to its frequency at the respective time point. For each RM, the top logo depicts the infecting SCIV, with subsequent logos representing longitudinal time points denoted in weeks (wk). To highlight mutations, the infecting virus sequence is blanked out for all longitudinal time points. Positively charged amino acids (R, H, K) are colored blue, negatively charged amino acids (D, E) are colored red, potential N-linked glycosylation sites are denoted as “O” and colored cyan, and gray bar indicate deletions. The webtool AnalyzeAlign from the Los Alamos HIV Databases was used for to generate the logos.
