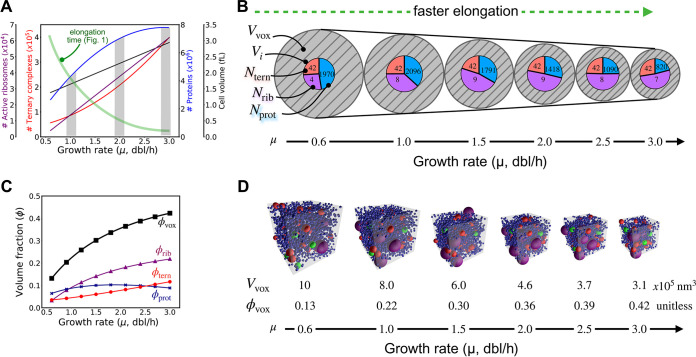
FIG 3.
The relative abundances, concentrations, and volume fractions of translation molecules change as growth quickens. (A) Experimental observations of active ribosomes, ternary complexes, and protein abundances in E. coli, as well as E. coli cell volume, reveal varying levels of increase with increasing growth rate (gray bars highlight values at particular growth rates). (B) An abstracted representation of translation voxels as a function of growth rate reveals that differential changes in molecular abundances are accompanied by an overall increase in crowding (i.e., stoichiometric crowding). The volume of translation voxels (Vvox; hatched gray circles) decreases while the total volume of constituent biomolecules (concentric pie charts) remains relatively constant. The total number of each particular type of biomolecule species (Ntern, Nrib, and Nprot), shown within corresponding colors of the pie chart (red, ternary complexes; purple, ribosomes; blue, proteins) in a given translation voxel as well as the total volume each biomolecule species occupies (Vi; the area of corresponding colors within the pie chart) change at different growth rates. (C) The volume fractions (ϕi = Vi/Vvox) of ribosomes (ϕrib), ternary complexes (ϕtern), and proteins (ϕprot) change differently with increasing growth rate, leading to an overall increase in the total occupied volume fraction of translation voxels (ϕvox). (D) Representative snapshots of translation voxel simulations at increasing growth rates, along with their respective volumes (Vvox) and volume fractions (ϕvox).

