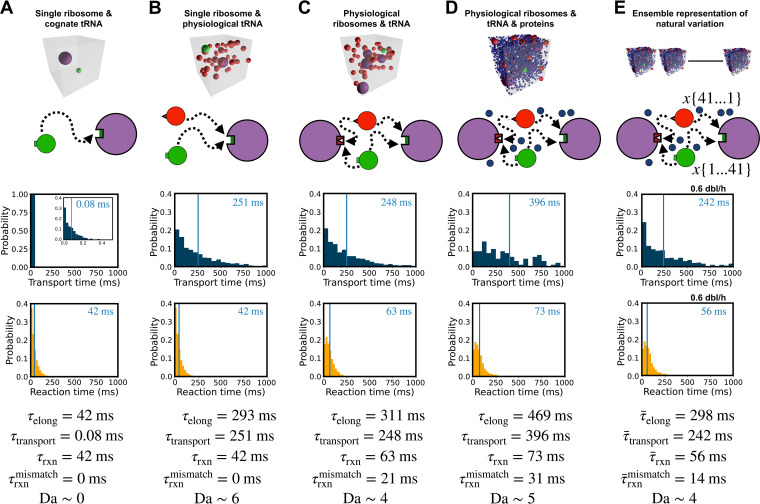
FIG 4.
Most of the latency in translation elongation arises from physical transport of ternary complexes. (A to E) Simulation snapshots, model schematics, and simulation results (top to bottom) for increasingly realistic (left to right) translation voxels at a growth rate of 0.6 dbl/h. In each plot, the average latency is marked by a blue vertical line and displayed on the top right in milliseconds. (A) A highly simplified translation voxel containing only a single ribosome and cognate ternary complex. (B) A translation voxel containing a single ribosome and 42 ternary complexes. (C) A translation voxel with 42 ternary complexes and four ribosomes. (D) A translation voxel with 42 ternary complexes, four ribosomes, and 1,970 proteins. (E) An ensemble of translation voxels that capture the expected natural variation in cognate, near-cognate, and noncognate ternary complexes due to nonuniform ternary complex and codon abundances coupled with spatial stochasticity. The standard errors in the estimate of the mean relative to the mean for transport latency and elongation latency are 3% for panels A to C, 9% for panel D, and 6% for panel E, while those for reaction latency are all below 1%.

