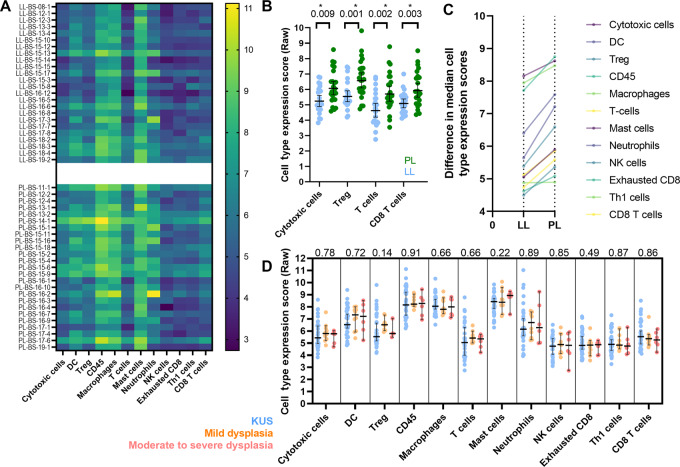
FIGURE 2.
A, Heat map comparing RNA expression of immunoregulatory genes among localized leukoplakia (LL; top) and proliferative leukoplakia (PL; ; bottom) samples with protein expression grouped by immune cell type of importance (in each column). Cell type raw scoring (dark to light) indicates increasing absolute degree of protein RNA expression. B, Protein RNA expression of all immunomodulatory genes grouped by immune cell of interest and compared between localized leukoplakia and proliferative leukoplakia samples (Mann–Whitney test). Median immune cell expression levels compared between localized leukoplakia and proliferative leukoplakia (higher slope equating to greater difference; C) and compared by degree of epithelial dysplasia histologically (Kruskal—Wallis test; D). *, P < 0.05; two-sided.

